
 Ethereum Chart By Trading View
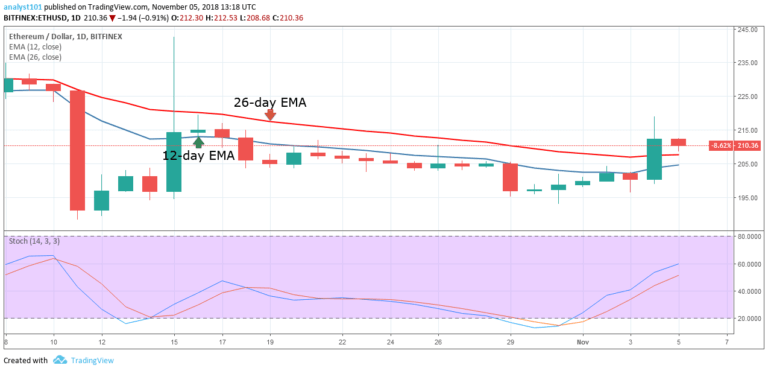
ETH/USD Medium-term Trend: Ranging
Resistance Levels: $200, $220, $240
Support Levels: $180, $160, $140
Last week the price of ETHUSD pair had been on a sideways trend. On October 29, the crypto’s price reached the oversold region and the bulls took control of the market. On October 30, the stochastic was above the range of 20 indicating a buy signal. On November 4, the crypto’s price reached the high of $218.92 while in a bullish trend.
Today, the Stochastic is approaching the range of 60, which means the momentum is increasing on the upside. However, the crypto’s price was resisted by the bears and price fell to the low of $209. The price is now fluctuating above the $200 price level. Meanwhile, the price of Ethereum is above the 12-day EMA and 26-day EMA which indicates that the price is in the bullish trend zone.
ETH/USD Short-term Trend: Ranging
 Ethereum Chart By Trading View
On the short-term trend, the price of Ethereum is in a sideways trend. The crypto’s price fell to the low of $209.01 and commenced a range bound movement. Meanwhile, the Relative Strength index period 14 is level 67 which indicates that the price is in the bullish trend zone.
The views and opinions expressed here do not reflect that of CryptoGlobe.com and do not constitute financial advice. Always do your own research.


