
 Ethereum Chart By Trading View
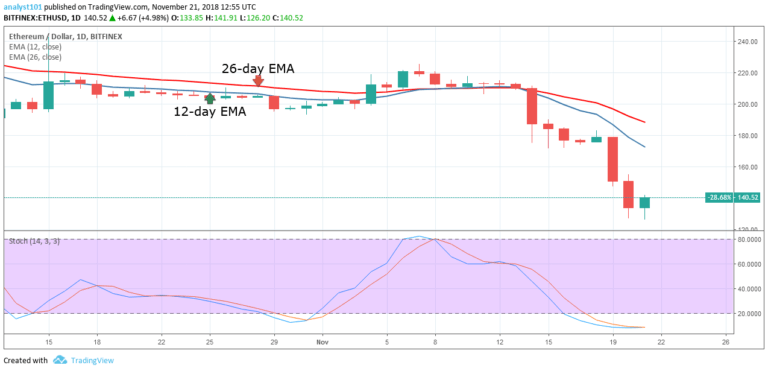
ETHUSD Medium-term Trend: Bearish
Resistance Levels: $230, $240, $250
Support Levels: $130, $120, $110
On November 20, the price of Ethereum was in a bearish trend. On November 14, ETH had a bearish breakout when the price was resisted by the 12-day EMA and the 26-day EMA. This caused the crypto’s price to fall to the low of $133.85. Today, the crypto’s price is in a bullish movement.
Meanwhile, the price of Ethereum is below the 12-day EMA and 26-day EMA which indicates that it is in the bearish trend zone. From the Stochastic indicator, the momentum of price is in the range below 20. That is the bearish momentum of Ethereum is strong. The bearish momentum of Ethereum will remain strong as long as the blue and the red bands of Stochastic remain in the oversold region.
ETHUSD Short-term Trend: Ranging
 Ethereum Chart By Trading View
On the short-term trend, the price of Ethereum is in a sideways trend. From the price action, the bearish pattern is no longer making a series of lower lows and lower highs. Rather, the crypto’s price is ranging above the $134 price level. In addition, the Stochastic is in the range above 20.
This indicates a buy signal as the blue band of Stochastic is above the red band. It also implies that the current trend has been reversed.
The views and opinions expressed here do not reflect that of CryptoGlobe.com and do not constitute financial advice. Always do your own research.


