
 Ethereum Chart By Trading View
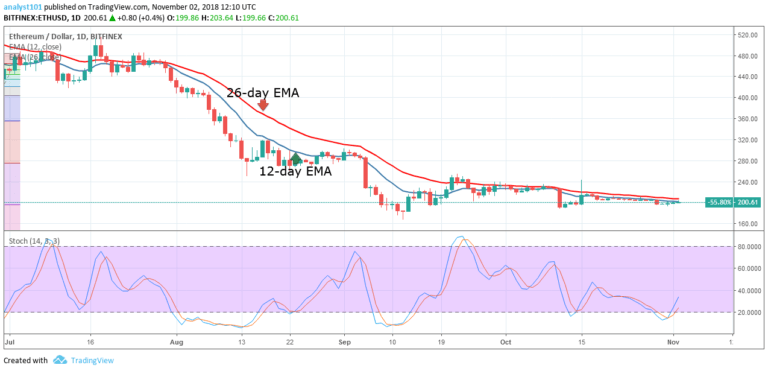
ETH/USD Medium-term Trend: Ranging
Resistance Levels: $200, $220, $240
Support Levels: $180, $160, $140
The price of Ethereum had been on a sideways trend. The crypto’s price has been fluctuating above the $200 price level. On October 29, the ETH price fell to the low of $195 and commenced a bullish movement. The 12-day EMA is acting as a resistance to the price of Ethereum. However, the stochastic indicator is above 20 for the digital currency. This indicates a buy signal.
The blue stochastic band is above the red band indicating that the trend is reversing from the oversold area. However, a break on the upside will see Ethereum reaching the high of $240. On the other hand, a break on the downside will push the price to the low of $183. If the cryptocurrency falls traders should look out for buy setups so as to initiate long trades.
ETH/USD Short-term Trend: Ranging
 Ethereum Chart By Trading View
On the short-term trend, the price of Ethereum is in a bullish trend. The price of Ethereum is in the bullish trend zone as it is above the exponential moving averages(EMAs). Meanwhile, the Relative Strength index period 14 is level 53 which indicates that the price is in a sideways trend zone.
The views and opinions expressed here do not reflect that of CryptoGlobe.com and do not constitute financial advice. Always do your own research.


