
 Ethereum Chart By Trading View
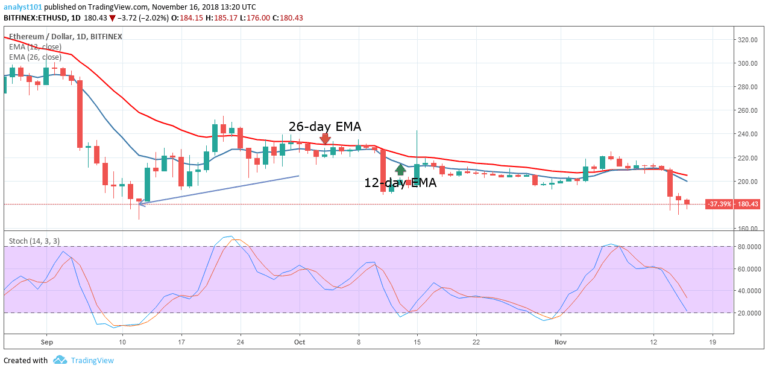
ETHUSD Medium-term Trend: Bearish
Resistance Levels: $230, $235, $240
Support Levels: $180, $160, $140
The ETHUSD pair is on a downward trend. The price of Ethereum broke the 12-day EMA and the 26-day EMA and fell to the previous low of September 12. On September 12, the cryptocurrency broke the 12-day EMA and fell to the low of $183.17 in a bearish trend. That bearish trend was interrupted by a Hammer candlestick. The bullish trend of September 13 reached the high of $247.80.
Today, the price of Ethereum may respect that historical price level. In another words, $180 price level may likely hold. If this level holds, traders should initiate long trades in anticipation of a bullish trend.
ETHUSD Short-term Trend: Bearish
 Ethereum Chart By Trading View
On the short-term trend, the price of Ethereum is in a bearish trend. The cryptocurrency fell to the low of $180 and commenced a range bound movement. The Stochastic indicator is above and below the range of 20 for a possible trend change. Meanwhile, the crypto’s price is below the 12-day EMA and 26-day EMA which indicates that price is in the bearish trend zone.
The views and opinions expressed here do not reflect that of CryptoGlobe.com and do not constitute financial advice. Always do your own research.


