
 Ethereum Chart By Trading View
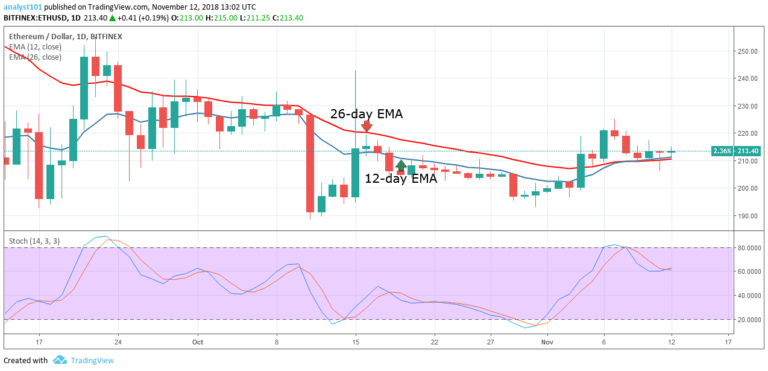
ETHUSD Medium-term Trend: Ranging
Resistance Levels: $230, $235, $240
Support Levels: $205, $200, $195
Last week the ETHUSD pair was in a bullish trend. From the bullish trend, the crypto’s price had a resistance at the price of $220. The resultant effect was a fall to the low of $211.67 and ETH commenced a range bound movement. The appearance of Spinning tops and Doji candlesticks explains the indecision of buyers and sellers at the $211.67 price level.
From the price action, the crypto’s price is above the 12-day EMA and the 26-day EMA indicating that the price is likely to rise. If the $200 price level holds traders should initiate long trades in anticipation of a bullish trend. The Stochastic is in the range of 60 which indicates a buy signal and the momentum of the price is increasing on the upside.
ETHUSD Short-term Trend: Ranging
 Ethereum Chart By Trading View
On the short-term trend, the price of Ethereum is in a sideways trend. The crypto’s price is neither above nor below the 12-day EMA and the 26-day EMA which indicates that the price is in the sideways trend zone. Meanwhile, the Relative Strength Index period 14 is level 51 which indicates that the price is in a sideways trend. The crypto is likely to encounter another price breakout.
The views and opinions expressed here do not reflect that of CryptoGlobe.com and do not constitute financial advice. Always do your own research.


