
ETHUSD Long-term Trend – Bearish
Distribution territories: $220, $240, $260.
Accumulation territories: $100, $80, $60.
Ethereum’s price has been ranging in the last few trading sessions before the crypto market’s big fall, between the $180 and $160 price territories. The cryptocurrency featured short ups and downs at the time.

On November 18, the cryptocurrency saw its price move north to test the upper side of its range, but then started falling on the next day. On November 19, it plummeted from the $177 mark to under $120 on November 13.
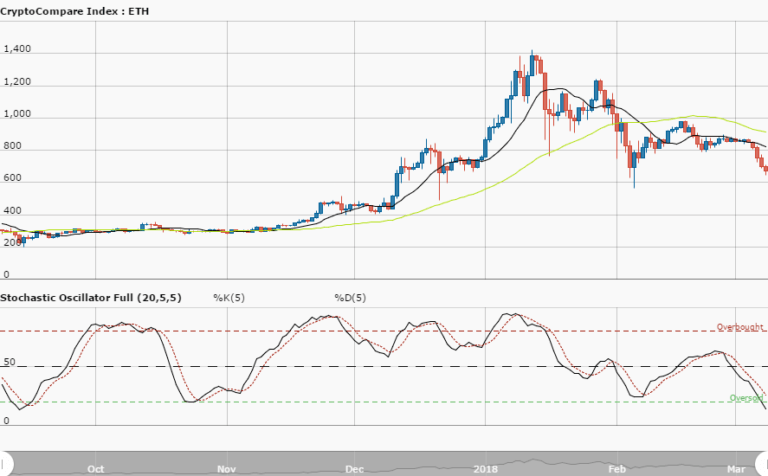
The 14-day SMA is currently below the 50-day SMA and they’re both above ETH’s price line. The Stochastic Oscillators dipped into the oversold zone and are consolidating within it. This has shown a strong potential for a bearish trend in the next few days.
A breakout at this point isn’t something to talk about, although a reversal could in time come when ETH hits the $120 or $100 mark.
The views and opinions expressed here do not reflect that of CryptoGlobe.com and do not constitute financial advice. Always do your own research.


