
ETHUSD Long-term Trend – Ranging
Distribution territories: $350, $450, $550.
Accumulation territories: $150, $100, $50.
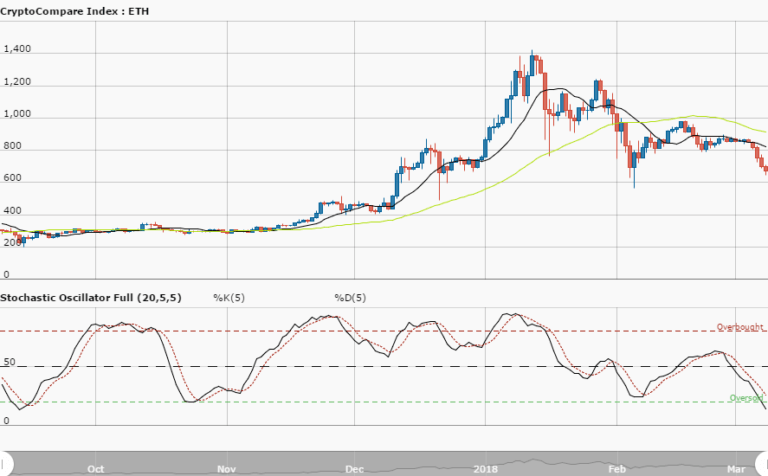
In the last trading sessions in the month of October, Ethereum’s price was intensely being traded under the 14-day SMA. In a couple of days, although the cryptocurrency featured a set of lower highs, it moved north past its 14-day and 50-day SMA’s trend lines, to approach the $220 territory.

Since then it has been trading around said territory and the 50-day SMA’s trend line. The 50-day SMA is above the 14-day one with a small space separating them. The Stochastic Oscillators touched range 80, and now point south towards range 60, which suggests a potential bearish movement may soon occur.
Currently the cryptocurrency is trading between the $220 and $180 territories, which could imply a strong price movement may soon come for the crypto. It would be good to buy ETH when its price dips.
The views and opinions expressed here do not reflect that of CryptoGlobe.com and do not constitute financial advice. Always do your own research.


