

EOSUSD Price Medium-term Trend: Bearish
Supply zones: $9.00, $10.00, $11.00
Demand zones: $2.00, $1.00, $0.50
EOS continues in a bearish trend in its medium-term outlook. The bears’ brief loss of momentum created bullish flags which temporarily lifted the price up. The bears returned afterward with much strong pressure that pushed the price further down in the demand area.
$3.52 in the supply area was the high the bulls could take the cryptocurrency before momentum loss creating the third flag. The bears gradually returning was indicated by the bearish hammer formation at $3.42. EOSUSD was initially down to $3.55 in the demand area.
This implies that the bullish correction was over and the next expected move is the bearish impulse move. With the price around the 10-EMA which has been a strong resistance,
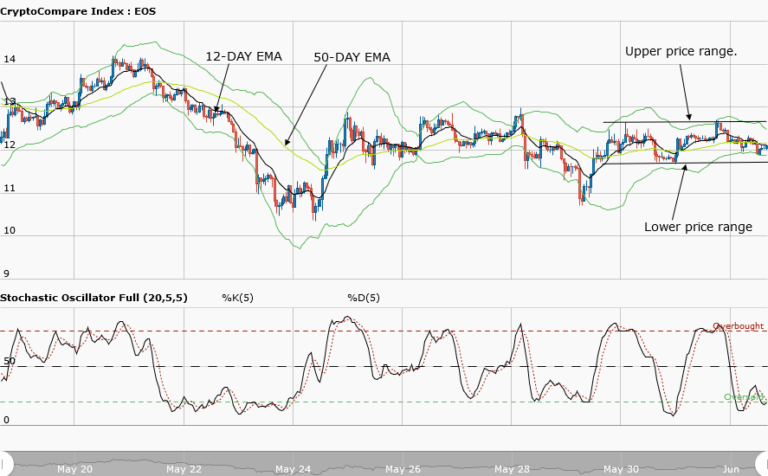
Further confirmation of the downward price movement is seen in the stochastic oscillator is at 36%. It signal points down.
EOSUSD Price Short-term Trend: Bearish

EOS continues in a bearish trend in its short-term outlook. After a bearish run to $3.08 in the demand area on 25th November, the bulls gradually staged a return with the formation of a bullish railroad at the demand area. EOSUSD rose to $3.52 in the supply area.
The price is below the two EMAs an indication of the bears’ strong pressure. The stochastic oscillator is at 58% and its signal points down which suggests downward price movement in the short-term.
EOS provide a nice bearish pennant pattern. This implies that the bears’ pressure may break down from the lower line and thus continue the downward journey in the short-term.
The views and opinions expressed here do not reflect that of CryptoGlobe.com and do not constitute financial advice. Always do your own research.


