
EOSUSD Long-term Trend – Bearish
Distribution territories: $10, $12, $14.
Accumulation territories: $4, $3, $2.
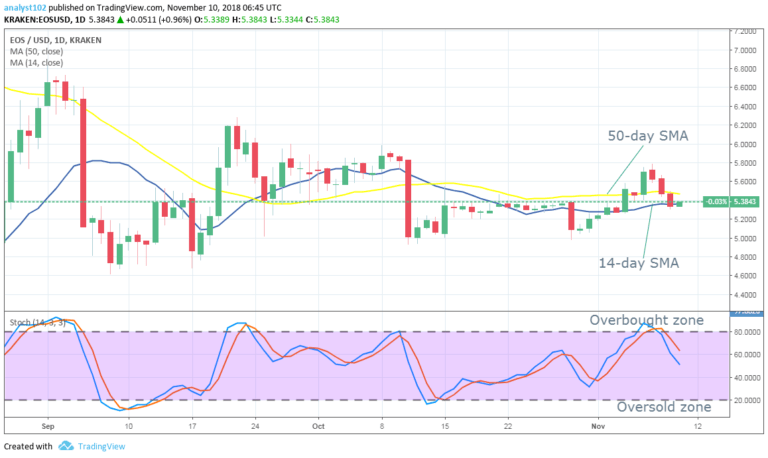
EOS’ price surged this week against the USD. On November 4, the cryptocurrency saw its price push from around the 14-day SMAs trend line northwards, past the 50-day SMA, to eventually test the $5.8 territory on November 7.

The cryptocurrency’s price is now being traded within the small space that’s found between the two SMAs. The 50-day SMA is currently above the 14-day one.The Stochastic Oscillators have moved from the overbought zone to point south around range 60.
This means the bears are gradually being able to change the market’s trend. A volatile bearish market could lead to the 14-day SMA being broken southward, which could see it fall below $5.2, $5, and even $4.8.
On the other side, bullish volatility near the 50-day Sma could see EOS approach its October 22 high.
The views and opinions expressed here do not reflect that of CryptoGlobe.com and do not constitute financial advice. Always do your own research.


