

ADAUSD Medium-term Trend: Bearish
Resistance levels: $0.080, $0.090, $0.100
Support levels: $0.075, $0.070, $0.065
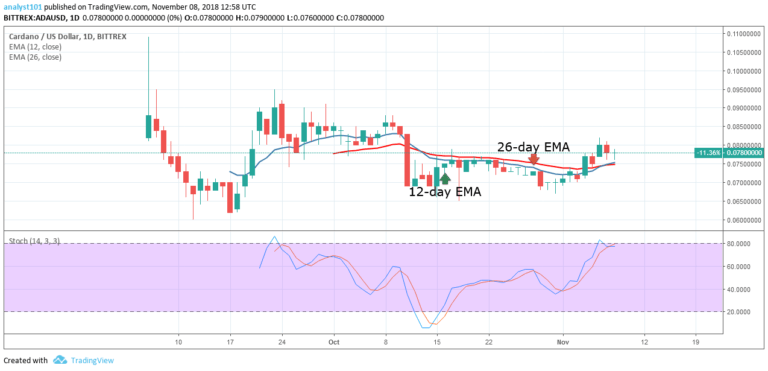
The price of Cardano was in a bearish trend yesterday. The crypto’s price fell because it tested the resistance level at $0.080. On October 29, the price of ADA fell to its previous low at $0.068, then it commenced a bullish movement to the high of $ 0.082. On November 7, the crypto’s price was resisted and it pulled back.
The crypto’s price is likely to fall on the $0.075 and $0.070 price levels. If the bears fail to break the $0.075 price level, the ADA price is likely to resume its uptrend because the price is above the 12-day EMA and the 26-day EMA. However, if the bears break the $0.075 price level, it will find support at either $0.070 or $0.068.
Meanwhile, the ADA price is above the 12-day EMA and the 26-day EMA indicating that the price is likely to rise. However, the Stochastic is below 80 indicating a sell signal.
ADAUSD Short-term Trend: Bearish

On the 4-hour chart, the ADA price is in a bearish trend .The digital currency fell to the low of $0.76 and it is making a bullish movement to the upward. The Relative Strength Index period 14 is level 54 which indicates that the price is nearing the bullish trend zone.
The views and opinions expressed here do not reflect that of CryptoGlobe.com and do not constitute financial advice. Always do your own research.


