

ADAUSD Medium-term Trend: Bearish
Resistance levels: $0.080, $0.090, $0.100
Support levels: $0.045, $0.040, $0.035
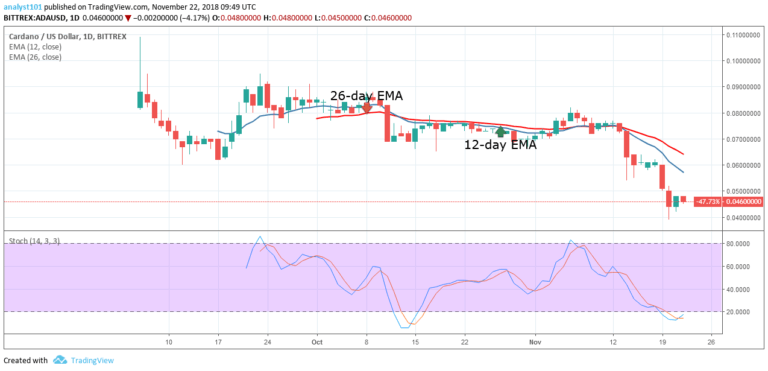
Yesterday, November 21, the price of Cardano was in a bullish trend. The crypto had been under a bearish pressure since November 14 when the price was resisted by the 12-day EMA.The bearish trend continued unabated until November 20 when the digital currency fell to its low at $0.044. The bears have lost control temporarily as the bulls took control.
The Stochastic indicator is in the range below 20 which means that the price has reached the oversold region. The blue band is above the red band and it is trying to make a U-turn to come out of the oversold region. If the Stochastic bands comes out of the oversold region and remains above 20; then it is a buy signal for ADA.
Meanwhile, the crypto’s price is below the 12-day EMA and the 26-day EMA which indicates that the price is in the bearish trend zone.
ADAUSD Short-term Trend: Ranging

On the 4-hour chart, the ADA price is in a sideways trend. The digital currency fell to the low of $0.043 and it commenced a range bound movement above the same price level. A bullish candlestick has broken the 12-day EMA and it is continuing its bullish movement. The price of Cardano will resume its uptrend if the price breaks the 12-day EMA and the 26-day EMA and remains above it.
The views and opinions expressed here do not reflect that of CryptoGlobe.com and do not constitute financial advice. Always do your own research.


