

ADAUSD Medium-term Trend: Bearish
Resistance levels: $0.080, $0.090, $0.100
Support levels: $0.055, $0.050, $0.045
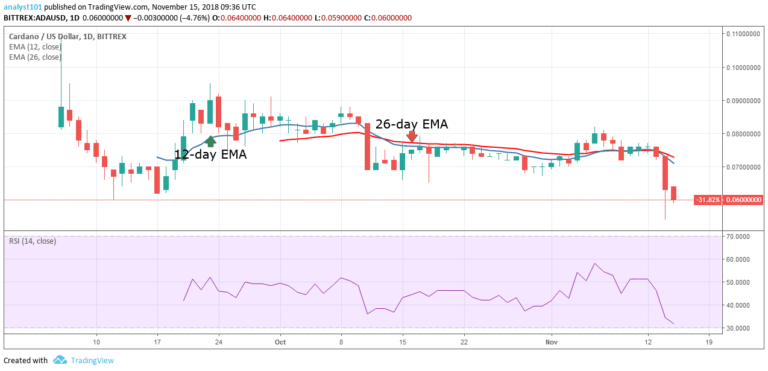
Yesterday, ADAUSD pair was in a bearish trend. On November 7, the crypto faced resistance at the $0.079 price level and it fell to the low of $0.072 and commenced a range bound movement. The 12-day EMA and the 26-day EMA were the horizontally flat indicating that the price was in a sideways trend. On November 14 the price broke the exponential moving averages (EMAs), and fell to the $0.060 price level.
The price of Cardano is below the 12-day EMA and the 26-day EMA indicating that the price is likely to fall. However, if the price breaks the $0.060 price level, the crypto will find support at $ 0.055. On the other hand, if the $0.060 price level holds, the crypto will be range bound between the levels of $0.060 and $0.080.
ADAUSD Short-term Trend: Bearish

On the 4-hour chart, the ADA price is in a bearish trend. The crypto’s price fell to the low of $0.061 and commenced a range bound movement. Meanwhile, the Relative Strength Index period 14 is level 23 which indicates that the price is in the oversold region suggesting bulls to take control of the market. Traders should look out for buy setups to initiate long trades if the $0.060 price level holds.
The views and opinions expressed here do not reflect that of CryptoGlobe.com and do not constitute financial advice. Always do your own research.


