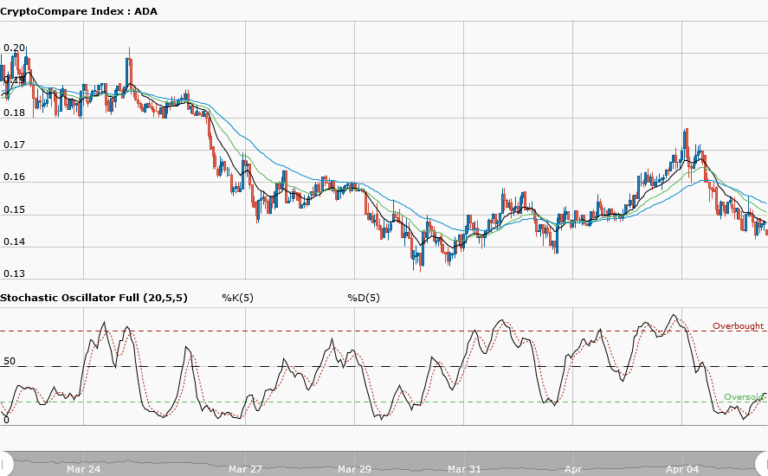
ADA/USD Long-term Trend –Bearish
Supply zone: $0.0600, $0.0800, $0.1000
Demand zone: $0.0100, $0.0080, $0.0060
ADA remains in a bearish trend in its long-term outlook. The strong bearish pressure remains consistent after the break and close below the key demand level at $0.06300 on 16th November. Confirmation to the bears’ takeover came on 18th November as the price retested the broken level one more time and close as an inverted hammer. ADAUSD dropped initially to $0.04889 in the demand area and made a lower low at the end of the week at $0.03594 on 24th November.
The new week opened with ADAUSD at $0.03897 lower than the previous week’s opening at $0.06400. With the price below the two EMAs and the EMAs are fanned apart which implies strength in the context of the downtrend. The stochastic oscillator is in the oversold region at 7% and its signal points down suggesting downward price movement.
The break at key level 1 on 13th August and subsequent retest down to the break at level 2 on 16th November gave about 4,567 pips. By measured move, the break to level 3 may give the same pip count that may see ADAUSD at $0.01400 in the demand area as the bearish momentum increases in the long-term.
The views and opinions expressed here do not reflect that of CryptoGlobe.com and do not constitute financial advice. Always do your own research


