
ADA/USD Long-term Trend –Bearish
Supply zone: $0.09000, $0.1000, $0.10500
Demand zone: $0.0600, $0.0300, $0.0001
ADA is in a bearish trend in its long-term outlook. The bulls were in control of the market last week from 4th November. The bullish engulfing candle at $0.07181 confirmed their hold on the market with a push of ADAUSD to $0.07907 in the supply area. Increased momentum pushed ADAUSD to $0.08295 in the supply area on 7th November before losing momentum.
Exhaustion to further upward price occurred as the daily candle closes with a wick. This was also after a touch at the downward trendline. This provides a good confluence for selling position.

The price of ADAUSD was initially down to $0.07368 in the demand area on 9th November before the minor pullback by the bulls to $0.07822. in the supply area on 11th November.
The formation of a bearish doji signaled a possible trend reversal and bears return. Initially, $0.07510 in the demand area was attained by the cryptocurrency today.
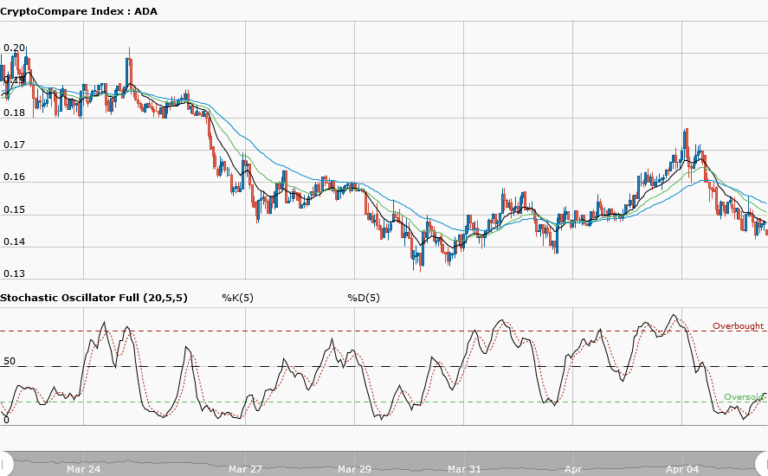
The price is below the two EMAs and the stochastic oscillator is at 57% and its signal undefined which implies a shift may occur after more candles opened and closed below the EMAs – indicating strong bearish pressure in the long-term.
The views and opinions expressed here do not reflect that of CryptoGlobe.com and do not constitute financial advice. Always do your own research.


