

Bitcoin Medium-term Trend: Bearish
Resistance levels: $7,000, $7,200, $7,400
Support levels: $4,000, $3,800, $3,600
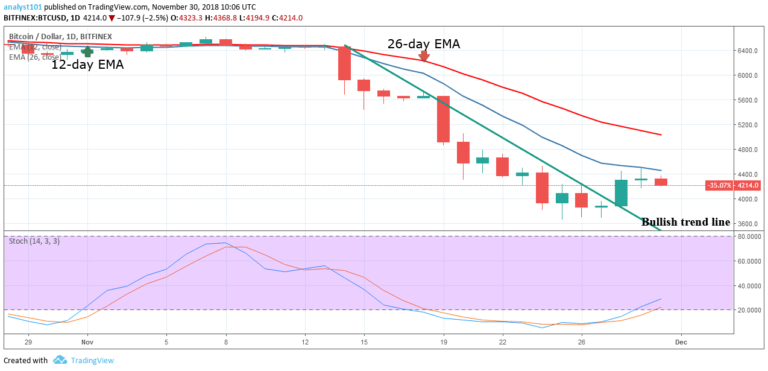
The BTCUSD pair was in a bullish trend yesterday. In the lower time frame, the crypto’s price is above the 12-day EMA and the 26-day EMA indicating that price is rising. The trend line has been broken and the following candlesticks closed on the opposite of the trend line.
The Stochastic bands are above the 20% range indicating a buy signal. When the blue band of the Stochastic is above the red band; it means that the current trend has been reversed. Meanwhile, the price of Bitcoin has been fluctuating above the $4,000 price level since November 28.
BTC Price Short-term Trend: Ranging

On the 1-hour chart, the crypto’s price is in a sideways trend. On November 28, the price reached a high of $4,447.60 while in a bullish trend. On November 29, the bullish trend was interrupted and it fell to the low of $4,210 to commence a range bound movement. The price action is constituted with small body candlesticks like Doji and Spinning tops candlesticks describing the indecision of buyers and sellers.
The digital currency fluctuates above the $4,000 price level and it is expected to test the $4,500 price level. On the other hand, it may continue its range bound movement.
The views and opinions expressed here do not reflect that of CryptoGlobe.com and do not constitute financial advice. Always do your own research.


