

BTCUSD Medium-term Trend: Ranging
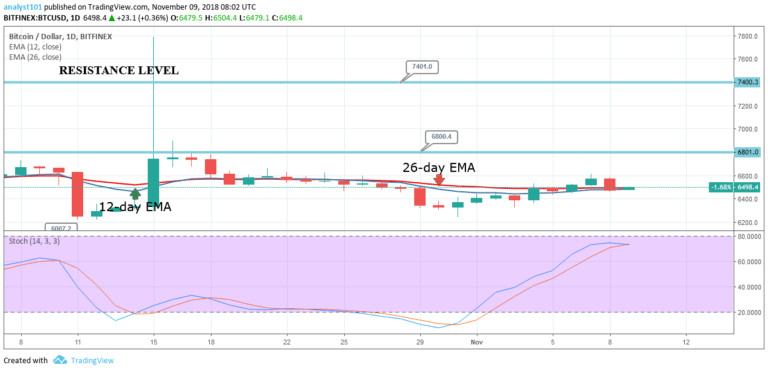
Resistance levels: $7,000, $7,200, $7,400
Support levels: $6,300, $6,100, $5,900
Yesterday, the BTCUSD pair was in a bearish trend. On November 8, the BTC price was resisted at the price of $5,585 after failing to break the $6,600 price level. The crypto’s price fell to the low of $6,475 and commenced a bullish movement. From the daily chart, the digital currency is likely to rise because the price is above the exponential moving averages (EMAs).
Secondly, as long as the crypto remains above the $6,400, it is likely to resume its uptrend. On the other hand, if the bears break the $6,400 price level, the price will be in the bearish trend zone. The price of Bitcoin will be weakened and the previous lows are likely to be revisited. In addition, the Stochastic is in the range of 80 which indicates a buy signal while the momentum of the price is increasing on the upside.
BTCUSD Short-term Trend: Bullish

On the 4-hour chart, the BTC price is in a bullish trend. On November 6, at the price of $6,480.40, the price of Bitcoin had the first bullish trend that was terminated the following day. On November 9, at the price of $6,479.50 another bullish trend is commencing. It is likely that the $6,600 price level will be tested again.
The views and opinions expressed here do not reflect that of CryptoGlobe.com and do not constitute financial advice. Always do your own research.


