

BTCUSD Medium-term Trend: Bearish
Resistance levels: $7,000, $7,200, $7,400
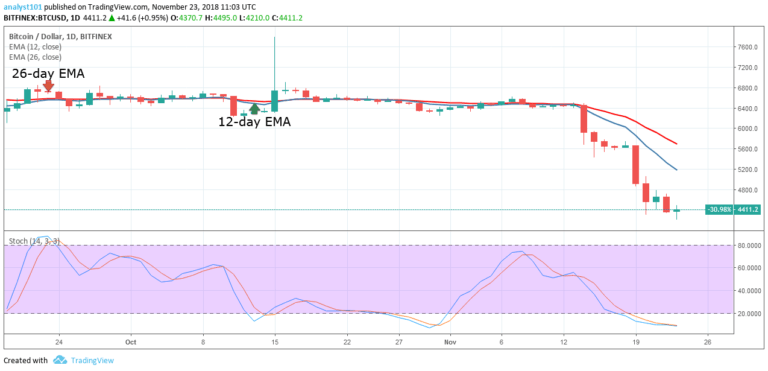
Support levels: $4,300, $4,100, $3,900
On November 22, the price of BTCUSD pair was in a bearish trend. Yesterday, the price fell to the low of $4,369.60 after a range bound movement. The 12-day EMA and the 26-day EMA were previously horinzontal but now pointing downwards.The crypto’s price is below the EMAs which indicates that price is likely to fall.
The Stochastic indicator is in the range below 20 which indicates a strong bearish momentum of Bitcoin. As the blue and red bands of the Stochastic indicator remains below 20, the oversold region; the digital currency will continue to be bearish. Nevertheless, if the crypto’s price falls below the $4,300 price level, the digital currency will likely find support at $4,000.
On the other hand, if the bulls defend the $4,300 price level; the digital currency is likely to reach the highs of $5,000 and $5,500.
Bitcoin Price Short-term Trend: Bearish

On the 4-hour chart, the crypto’s price is in a bearish trend. The crypto’s price fell to the low of $4,320.60 and it commenced a bullish movement. The bullish trend may face resistance at the 12-day EMA. Meanwhile, the blue band of the Stochastic indicator is above the red band indicating a buy signal for bitcoin.
The views and opinions expressed here do not reflect that of CryptoGlobe.com and do not constitute financial advice. Always do your own research.


