

BTCUSD Medium-term Trend: Bearish
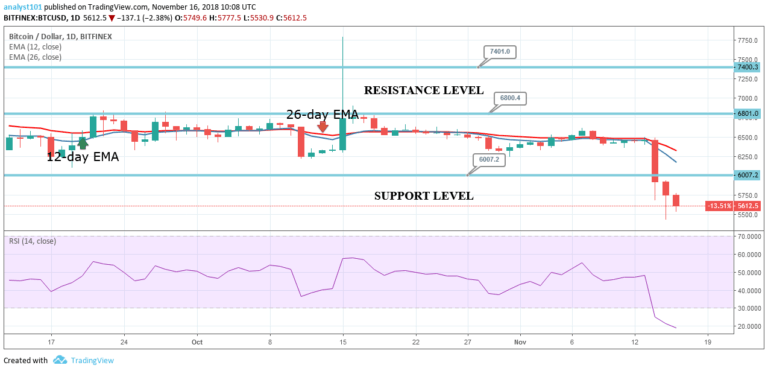
Resistance levels: $7,000, $7,200, $7,400
Support levels: $5,500, $5,300, $6,100
Yesterday the price of Bitcoin was in a bearish trend. On November 14, the bears had upper hand when the $6,000 price level was broken. The crypto’s price fell and it is now approaching the $5,500 price level.
From November 14, the bearish trend is making a series of lower highs and lower lows without any change in their bearish pattern. The price bars are below the 12-day EMA and the 26-day EMA which indicates that price is likely to fall.
If the $5,500 holds, the digital currency will be range bound around the $5,500 price level. Meanwhile, the Relative Strength Index period 14 is level 18 which indicates that the market is oversold suggesting bulls to take control of the market, albeit briefly.
BTCUSD Short-term Trend: Ranging

On the 4-hour chart, the crypto’s price is in a sideways trend. On November 15, the crypto’s price fell to the low of $5,591.30 and commenced a range bound movement. From the chart bears temporarily lost control when the bulls pulled back but the Stochastic is above 20 on the downside indicating further bearish pressure.
The views and opinions expressed here do not reflect that of CryptoGlobe.com and do not constitute financial advice. Always do your own research.


