

BTCUSD Medium-term Trend: Ranging
Resistance levels: $7,000, $7,200, $7,400
Support levels: $6,300, $6,200, $6,100
The BTCUSD pair was in a sideways trend yesterday. Since November 1, the price of Bitcoin has been sustained above the $6,400 price level. On October 30, the crypto’s price rose from the price of $6,346.60 to the high of $6,615 on November 7. In the same vein, the momentum of price increase on the upside in the range below 80 . However, the Stochastic indicator has fallen below the range of 60.
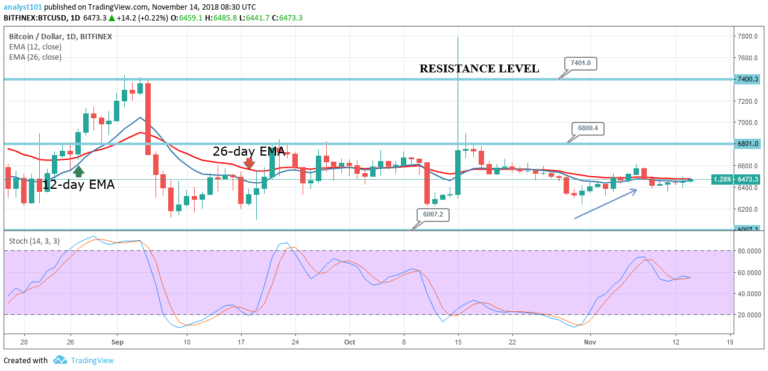
This was because on November 8, the price of Bitcoin was resisted at the $6.600 price level. The crypto’s price fell to the low of $6,400 and commenced its range bound movement. The appearance of Doji and Spinning tops candlesticks showed the indecision of buyers and sellers at the $6,400 price level. The 12-day EMA and the 26-day EMA are horizontally flat indicating that the price is in the sideways trend.
Meanwhile, the crypto’s price is below the 12-day EMA and the 26-day EMA indicating that price is in the bearish trend zone.
BTCUSD Short-term Trend: Ranging

On the 4-hour chart, the BTC price is in a sideways trend. The crypto’s price is above the 12-day EMA and the 26-day EMA indicating that the price is the bullish trend zone. The Stochastic is in the range below 80 which indicates a buy signal and that the price momentum is increasing on the upside.
The views and opinions expressed here do not reflect that of CryptoGlobe.com and do not constitute financial advice. Always do your own research.


