
BTCUSD Long-term Trend – Bearish
Distribution territories: $6,250, $7,250, $8,250.
Accumulation territories: $2,800, $2,600, $2,400
About a week ago, Bitcoin’s price started dropping significantly, so much so that on Novembr 15 and 18 the cryptocurrency briefly stopped around the $5,750 and the $5,250 price territories.

On November 19 the cryptocurrency went back to its downward trajectory and move from about $5,500 to a $4,000 low before continuing its decline. The 50-day SMA is over the 14-day SMA.
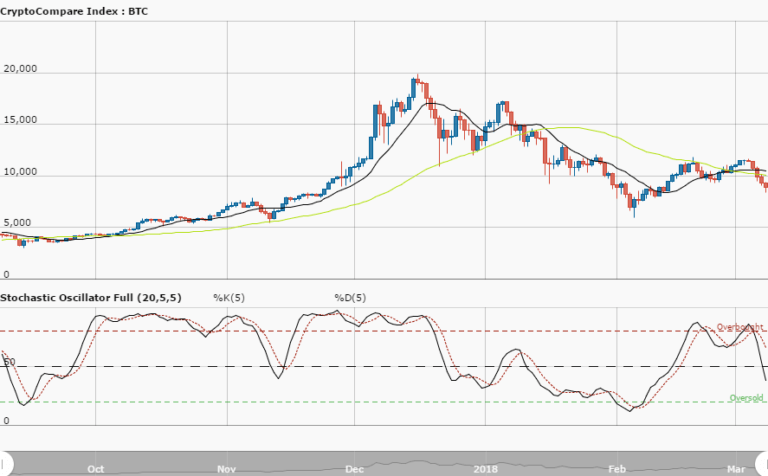
The Stochastic Oscillators dipped into the oversold zone, and appear to be pointing south which suggests the bearish trend isn’t yet over. The bears are currently on top of BTC’s price and are currently facing the $3,200 accumulation point, which could be broken southward. This would lead to new lows between $2,800 and $2,600.
The $4,800 mark is a crucial one as once BTC hits it a bullish trend may come back. A bull trap is something to pay attention to.
The views and opinions expressed here do not reflect that of CryptoGlobe.com and do not constitute financial advice. Always do your own research.


