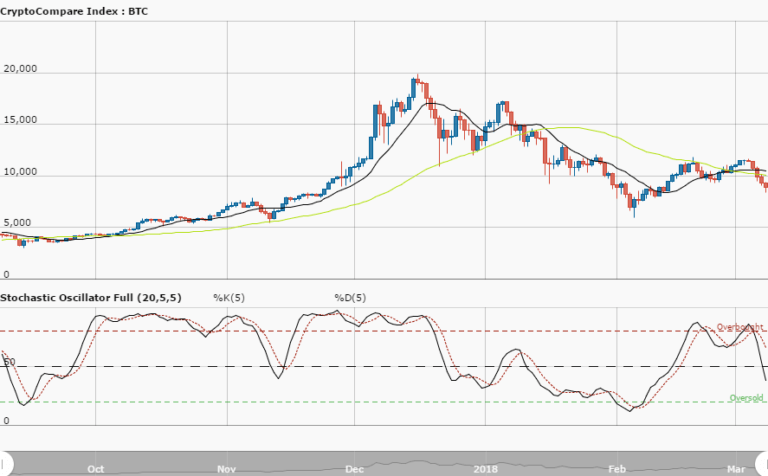
BTCUSD Long-term Trend – Ranging
Distribution territories: $7,500, $8,500, $9,500.
Accumulation territories: $5,500, $5,000, $4,500
On September 5, bitcoin’s price declined and breach the $6,800 territory, which saw it go down to a $6,000 mark on October 10. The cryptocurrency’s recent high on October 15 saw it surge upwards once more, to test $6,800.
Looking closely, the two previously mentioned price territories are now defining the flagship cryptocurrency’s trading range. Both its SMAs are within the range, with a short space separating the 50-day SMA from the 14-day SMA.
The Stochastic Oscillators have headed north to close to range 50. This means the cryptocurrency is finding a ground to push against BTC, although it may continue within the boundaries of its ranging trend for the next few trading sessions. A sudden breach of the range could lead to a trap.
The views and opinions expressed here do not reflect that of CryptoGlobe.com and do not constitute financial advice. Always do your own research.


