

XRPUSD Medium-term Trend: Bearish
Resistance Levels: $0.59, $0.61, $ 0.63
Support Levels: $0.45, $0.43, $0.41
The XRPUSD pair had been bearish since October 1. The cryptocurrency was previously ranging between the levels of $0.50 and $0.60. However, the bearish trend broke the lower level of price range to the low of $0.46. This is an opportunity for traders to initiate long trades at the lower level of price range in anticipation of a bullish trend. A stop loss order below the $0.45 price level should be placed.
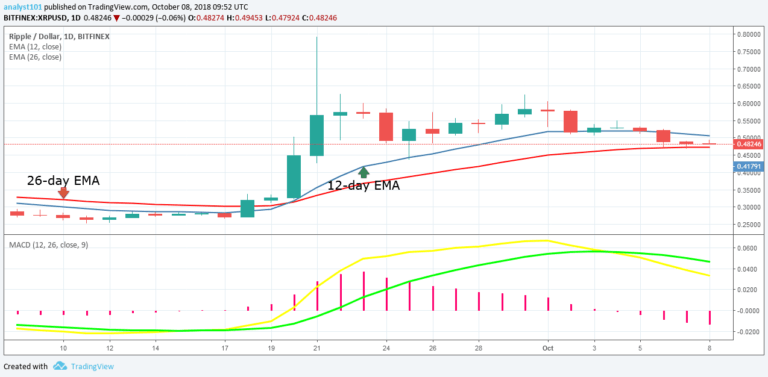
Open trades should be exited near the upper level of price range. Today, the cryptocurrency is in a bullish movement and approaching the price of $0.48 but will face resistance at the $0.60 price level. Nevertheless, the pair is still in the bearish zone as the XRP price is below the 12-day EMA and the 26-day EMA which indicates that a bearish trend is ongoing.
The MACD line and the signal line are above the zero line which indicates a buy signal.
XRPUSD Short-term Trend: Bearish

On the 4-hour chart, the XRP price is in a bearish trend. The XRP price is below the 12-day EMA and the 26-day which indicates that a bearish trend is ongoing. Nevertheless, the Relative Strength Index period 14 is level 40 which indicates that a sideways trend is ongoing.
The views and opinions expressed here do not reflect that of CryptoGlobe.com and do not constitute financial advice. Always do your own research.


