

XRPUSD Medium-term Trend: Bearish
Resistance Levels: $0.59, $0.61, $ 0.63
Support Levels: $0.52, $0.50, $0.48
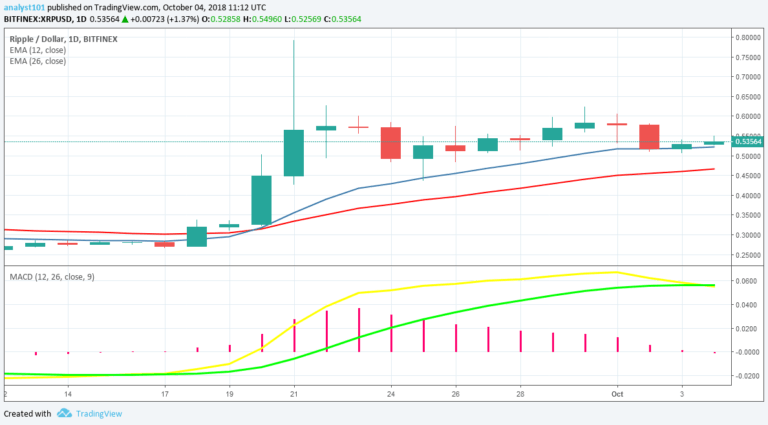
The XRPUSD pair was in a bearish trend. The cryptocurrency fell to the low of $0.52 and commenced a bullish movement. Also, it is fluctuating between the levels of $50 and $60. Traders should seize the opportunity of initiating long trades at its low and short trades at its high whenever a cryptocurrency is range bound. This enables a trader to earn partial profits at the end of each price movement.
Meanwhile, the XRP price is approaching the $60 price level which is the upper level of price range. If it breaks the upper level and the price holds it will resume its uptrend. Nevertheless, XRP price is above the 12-day EMA and the 26-day EMA which indicates that the bullish trend is ongoing. The MACD line and the signal line are above the zero line which indicates a buy signal.
XRPUSD Short-term Trend: Ranging

On the 4-hour chart, the XRP price is in a range bound movement. The price is still below the 12-day EMA and the 26-day EMA which indicates that a bearish is ongoing. Nevertheless, the Relative Strength Index period 14 is level 46 which indicates that a sideways trend is ongoing.
The views and opinions expressed here do not reflect that of CryptoGlobe.com and do not constitute financial advice. Always do your own research.


