

XRPUSD Medium-term Trend: Bearish
Resistance Levels: $0.59, $0.61, $ 0.63
Support Levels: $0.54, $0.52, $0.49
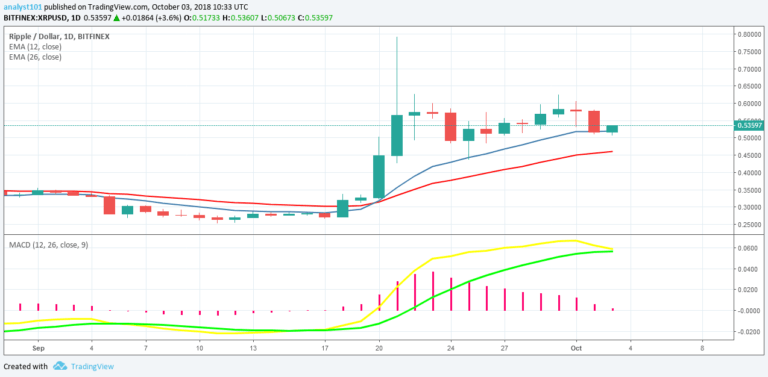
Yesterday, October 2, the XRPUSD pair was in a bearish trend. The price broke out from the $0.57 price level to the low of $0.51. The XRP price is now consolidating at this price level. The buyers and sellers pause at this point to know which direction price will go. At the lower time frame if the price tests and bounces back, the bearish trend will continue; then price might likely fall again to the low of $0.45.
On the other hand, if the price breaks the trend line and closes on the opposite of it, then the bearish trend might be over. Nevertheless, XRP price is above the 12-day EMA and the 26-day EMA which indicates that the bullish trend is ongoing. The MACD line and the signal line are above the zero line which indicates a buy signal.
XRPUSD Short-term Trend: Bearish

On the 4-hour chart, the XRP price is in a bearish trend. The XRP price is making a bullish movement towrds the trend line. If it breaks the trend line and closes, the cryptocurrency will no longer depreciate. Nevertheless, the Relative Strength Index period 14 is level 43 which indicates that a sideways trend is ongoing.
The views and opinions expressed here do not reflect that of CryptoGlobe.com and do not constitute financial advice. Always do your own research.


