

XRPUSD Medium-term Trend: Ranging
Resistance Levels: $0.50, $0.52, $ 0.54
Support Levels: $0.40, $0.38, $0.36
Yesterday, the XRPUSD pair was in a sideways trend. From the chart, the price action shows Doji and Spinning tops candlesticks indicating that the bulls and the bears are said to be in equilibrium at the $0.46 price level. The consequence is that as the price is consolidating at the $0.46 price level; there is a likelihood of a price breakout.
A bullish breakout will ensure the $0.50 price level is broken. Then as the price is sustained above the $0.50 price level, the XRP price will likely commence its uptrend to the highs of $0.55, $0.60 and $0.70. On the other hand, if the price breaks below the $0.46 price level, the crypto will find support at $0.38. Meanwhile, the Relative Strength Index period 14 is level 50 which indicates that the XRP price is in a sideways trend.
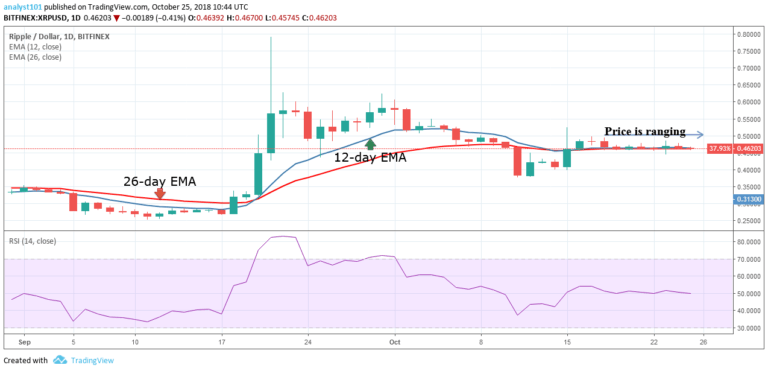
XRPUSD Short-term Trend: Ranging

On the short term trend, the XRP price is range bound. The crypto’s price bars, the 12-day EMA and 26-day EMA are horizontally flat indicating a sideways trend. The XRP price is below the exponential moving averages indicating that th eprice is in the bearish trend zone.
The views and opinions expressed here do not reflect that of CryptoGlobe.com and do not constitute financial advice. Always do your own research.


