

XRPUSD Medium-term Trend: Ranging
Resistance Levels: $0.50, $0.52, $ 0.54
Support Levels: $0.42, $0.40, $0.39
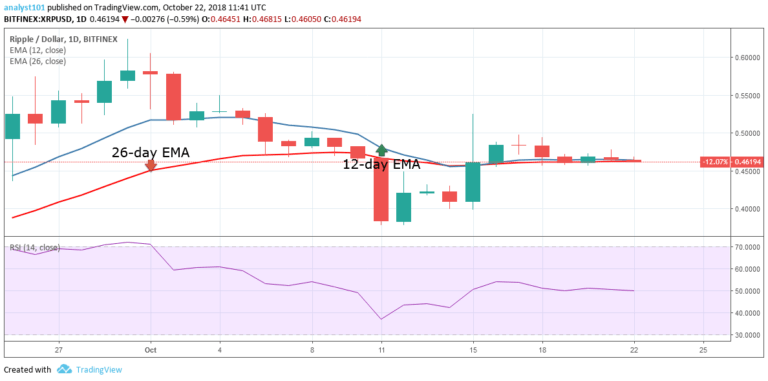
The XRPUSD pair was in a sideways trend last week. On October 18, the XRP price fell to the low of $0.46 and commenced a range bound movement. Today, the cryptocurrency is back and ranging at the $0.46 price level. The crypto’s price could have corrected itself by finding support at the previous low of $0.44.
The XRP price and the exponentia moving averages are horizontally flat – indicating that the crypto is likely to continue its range bound movement. The XRP price is neither above nor below the 12-day EMA and the 260-day EMA which also signals a sideways trend. Meanwhile, the Relative Strength Index period 14 is level 50 which indicates that it is in a sideways trend.
XRPUSD Short-term Trend: Bearish

On the short term trend, the XRP price is in a bearish trend. The crypto’s price is below the exponential moving averages (EMAs) indicating that the price is falling. If the cryptocurrency breaks out its consolidation and falls it will find support at either $0.43 or $0.44 price level. If the price falls in that direction, traders should initiate long trades in anticipation of a bullish trend.
The views and opinions expressed here do not reflect that of CryptoGlobe.com and do not constitute financial advice. Always do your own research.


