

XRPUSD Medium-term Trend: Ranging
Resistance Levels: $0.50, $0.52, $ 0.54
Support Levels: $0.42, $0.40, $0.38
Yesterday, the XRPUSD pair was ranging above the $0.46 price level. The crypto’s price was on a downward trend after its failed attempt to break the resistance at $0.50. It was suggested yesterday that the crypto would fall to its previous support at $0.45, if it fails to resume its uptrend. The cryptocurrency is now struggling to sustain price at the $0.45 price level.
However, if the bulls sustain their hold at this price level, it will commence a bullish movement. But if it falls again, the XRP price will fall to its previous low at $0.43. However, at this price level of $0.43, traders should immediately initiate long trades in anticipation of a bullish trend. A stop-loss order should be placed below the $0.43 price level. Meanwhile, the Relative Strength Index period 14 is level 52 which indicates that the XRP price is in a sideways trend zone.
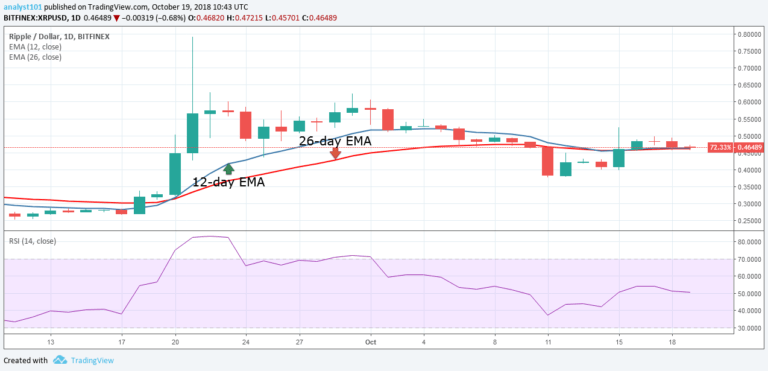
XRPUSD Short-term Trend: Bearish

On the short term trend, the XRP price is in a bearish trend. The bulls failed to hold the $0.46 price level as the cryptocurrency depreciates further. The crypto’s price is below the exponential moving averages (EMAs) indicating that the price is falling.
The views and opinions expressed here do not reflect that of CryptoGlobe.com and do not constitute financial advice. Always do your own research.


