

XRPUSD Medium-term Trend: Bullish
Resistance Levels: $0.50, $0.52, $ 0.54
Support Levels: $0.46, $0.44, $0.42
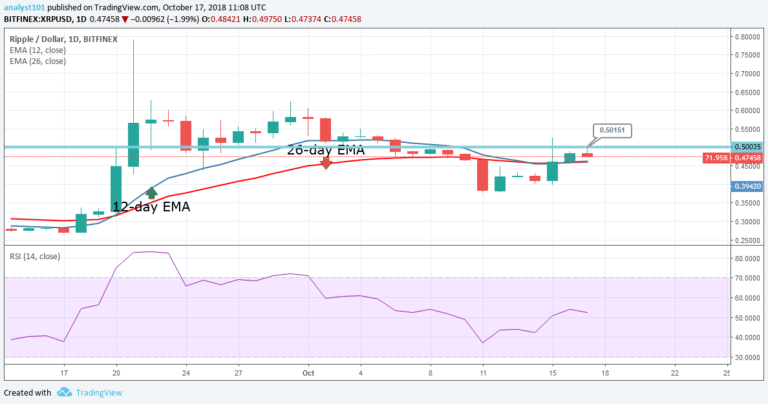
Yesterday, the XRPUSD pair was in a bullish trend approaching the $0.50 price level. Yesterday, the crypto’s price reached the high of $0.48. However, a bullish trend line is drawn to determine whether the cryptocurrency will break the $0.50 resistance level. The understanding is that if it does, XRP price will gather momentum and resume its uptrend.
From the lower time frame, a bullish trend line is drawn touching the swing low and bodies of at least three candlesticks. The verdict is that the XRP price is not likely to break the $0.50 price level – firstly, because the price is no longer trending on the bullish trend line. Secondly, a candlestick has broken the trend line and the following candlestick closes below it; thus terminating the bullish trend .
Meanwhile, the Relative Strength Index period 14 is level 52 which indicates that the crypto’s price is in a sideways trend.
XRPUSD Short-term Trend: Bullish

On the short term trend, the XRP price is in a bullish trend. Today, the cryptocurrency is approaching the $0.50 price level. If the XRP price is resisted at the $0.50 price level, a short trade should be initiated and a stop loss above the $0.50 price level.
The views and opinions expressed here do not reflect that of CryptoGlobe.com and do not constitute financial advice. Always do your own research.


