

XRPUSD Medium-term Trend: Bearish
Resistance Levels: $0.45, $0.43, $ 0.41
Support Levels: $0.35, $0.33, $0.31
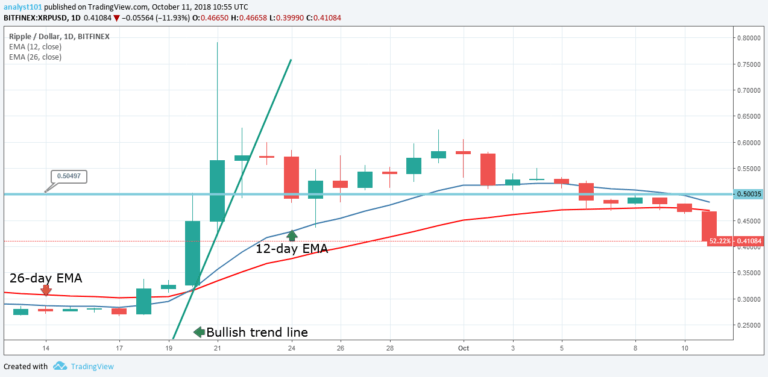
The XRPUSD pair is in a bearish trend as it is set to erase the gains of September 20 price rally. From the chart, the bullish trend line was broken by price, and the XRP price went into a range bound movement. In the process of time, the $0.50 price level was broken below and price commenced a downward trend.
Thereafter the bearish trend for the cryptocurrency began. The XRP price could not break upward the $0.50 price level in order to resume its upward trend. There are indications that the cryptocurrency may revisit its September 20 low of $0.33.
XRPUSD Short-term Trend: Bearish

On the short term trend, the cryptocurrency is approaching the price at $0.41. However, the XRP price will continue its downward trend because the price is below the exponential moving averages. Nevertheless, the Relative Strength Index period 14 is level 17 which indicates that the market is oversold. That is the bears are exhausting their bearish pressure.
The views and opinions expressed here do not reflect that of CryptoGlobe.com and do not constitute financial advice. Always do your own research.


