

XRPUSD Medium-term Trend: Bullish
Resistance Levels: $0.59, $0.61, $ 0.63
Support Levels: $0.55, $0.53, $0.51
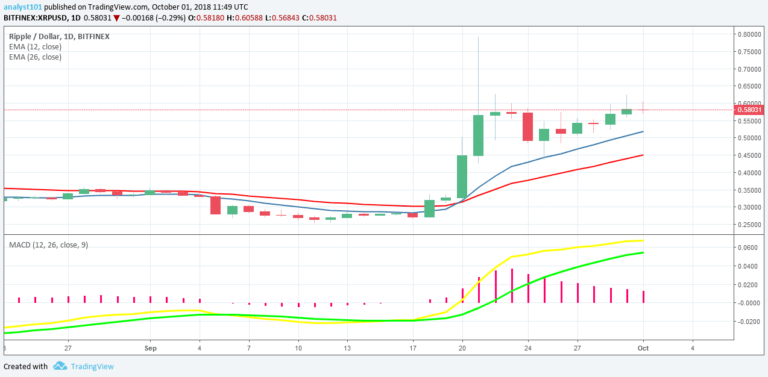
Last week the XRP price had been fluctuating above the $0.53 price level. On September 30, the cryptocurrency reached the high of $0.62 but price pulled back to the low of $0.56. The bulls could not progress beyond the $0.60 price level because of the resistance at that level.
The cryptocurrency is likely to be in a range bound movement having been resisted. Meanwhile, XRP price is above the 12-day EMA and the 26-day EMA which indicates that the bullish trend is ongoing. The MACD line and the signal line are above the zero line which indicates a buy signal.
XRPUSD Short-term Trend: Ranging

On the 4-hour chart, the price of XRP price broke the bullish trend line resulting in a range bound movement. The XRP price is also above the 12-day EMA and 26-day EMA which indicates that price is rising. The Relative Strength Index period 14 is level 52 which indicates that the price is in the sideways trend zone.
The views and opinions expressed here do not reflect that of CryptoGlobe.com and do not constitute financial advice. Always do your own research.


