
 Litecoin Chart by Trading View
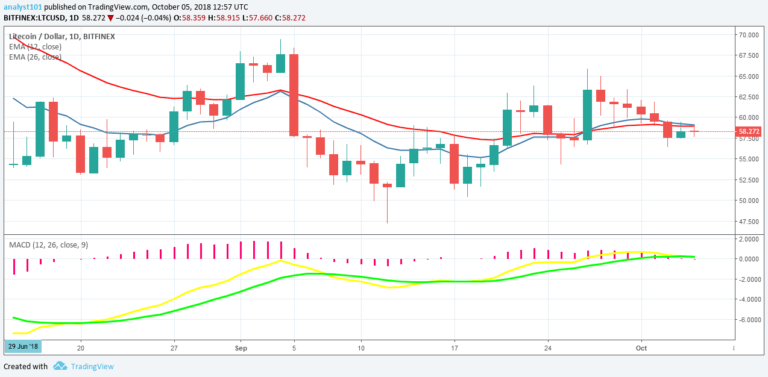
LTCUSD Medium-term Trend: Ranging
Resistance Levels: $63, $65, $67
Support Levels: $55, $53, $51
The price of Litecoin is in a range bound movement. On September 27, the LTC price reached the high of $64.13. The cryptocurrency was resisted because it was range bound between the levels of $50 and $65. The LTC price fell in a downward trend from September 27 to October 3, 2018. Presently, the LTC price is ranging at the price of $58.
However, since the price of Litecoin is fluctuating between the range-bound levels, traders should initiate long trades at the price of $58 in anticipation of a bullish trend. Meanwhile, the LTC price is below the 12-day EMA and the 26-day EMA which indicates that a bearish trend is continuing. The MACD line and Signal line are at par with the zero line which indicates a neutral signal.
LTCUSD Short-term Trend: Ranging
 Litecoin Chart by Trading View
On the 4-hour chart, the LTC price is in a range bound movement. The price of Litecoin is below the 12-day EMA and the 26-day EMA which indicates that a bearish trend is ongoing. The Relative Strength Index period 14 is level 44 indicates that the price is in a sideways trend zone.
The views and opinions expressed here do not reflect that of CryptoGlobe.com and do not constitute financial advice. Always do your own research.


