
 Litecoin Chart by Trading View
LTCUSD Medium-term Trend: Ranging
Resistance Levels: $65, $67, $69
Support Levels: $52, $50, $48
The price of Litecoin is in a sideways trend after three weeks in a bearish trend. From the daily chart, indecisive spinning top candlesticks are forming at a price of $0.52. It indicates that the supply and demand levels are said to in equilibrium at $0.52. Presently, the price of Litecoin is at the bottom or lower level of the price range.
A breakdown at the $50 price level will sink Litecoin to the lows of $40 or $45. However, on the upside, a bullish breakout will ensure that the resistance level at $55 was broken then the price will rally at the $65 price level which is the upper level of price range. Trade recommendation is unnecessary as the price is still consolidating. In addition, the Relative Strength Index period 14 is level 40 which indicates that the price is in the sideways trend zone.
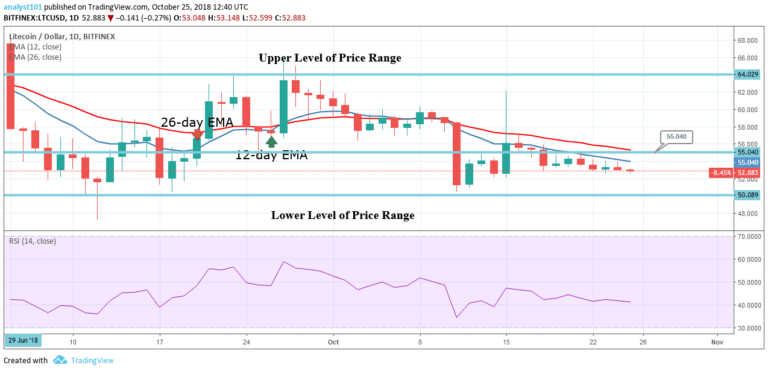
LTCUSD Short-term Trend: Ranging
 Litecoin Chart by Trading View
On the short term trend, the price of Litecoin is in a sideways trend. The crypto’s price and exponential moving averages (EMAs) are trending horizontally indicating a sideways trend. The price of Litecoin is below the 12-day EMA and 26-day EMA indicating that the price is in the bearish trend zone.
The views and opinions expressed here do not reflect that of CryptoGlobe.com and do not constitute financial advice. Always do your own research.


