
 Litecoin Chart by Trading View
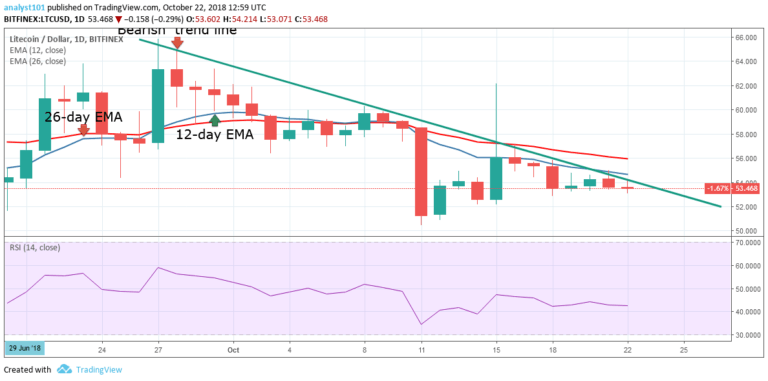
LTCUSD Medium-term Trend: Bearish
Resistance Levels: $63, $65, $67
Support Levels: $50, $52, $49
Last week, the LTCUSD pair was in a downward trend. The assumption was that if the bearish trend line was broken and the following candlestick closed above it, the bearish trend would have terminated. Today, the bearish trend is still continuing as the price failed to break the trend line. If the bearish trend continues the $50 price level will be tested or broken. It is the lower level of the price range.
Traders should be on the lookout for buy setups as the cryptocurrency is set to test the lower price level after three weeks in a downward trend. Traders should initiate long trades at the lower price level. Then a stop loss order below the $50 price level. The Relative Strength Index period 14 is level 42 which indicates that the price is in the sideways trend zone.
LTCUSD Short-term Trend: Bearish
 Litecoin Chart by Trading View
On the short term trend, the LTCUSD pair is in a downward trend. The litecoin price is still in the bearish trend zone below the exponential moving averages (EMAs).
The views and opinions expressed here do not reflect that of CryptoGlobe.com and do not constitute financial advice. Always do your own research.


