
 Litecoin Chart by Trading View
LTCUSD Medium-term Trend: Bullish
Resistance Levels: $6, $65, $67
Support Levels: $51, $49, $47
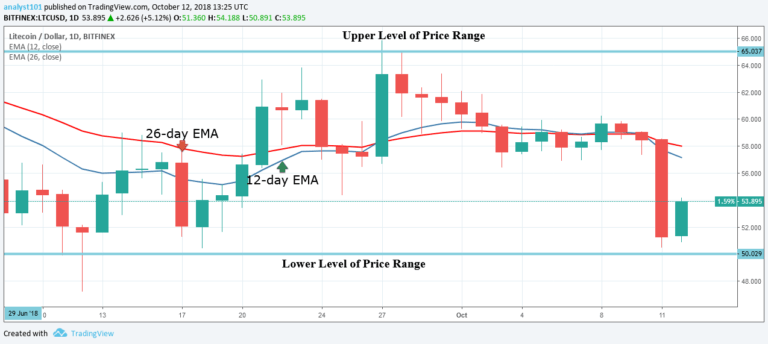
Yesterday, the price of was in a bearish trend and it fell to the low of $51.09. It was suggested yesterday that if crypto’s price reached the September’s low, the cryptocurrency is likely to revert back to the upper level of price range. Today, Litecoin is making a bullish movement away from its present low. It is assumed that traders have taken their various trade positions as the price of Litecoin moves to the upper level of price range. The crypto’s price is expected to face resistance at the $65 price level.
LTCUSD Short-term Trend: Bullish
 Litecoin Chart by Trading View
On the short term trend, the price of Litecoin is in a bullish trend. Although, LTC is still in the bearish zone as its price is below the exponential moving averages (EMAs) The crypto’s price fell the low of $51.27 but was repelled. Later, it commenced a bullish movement to come out of its present low. Meanwhile, the Relative Strength Index period 14 is level 42 which indicates that the crypto is in a sideways trend.
The views and opinions expressed here do not reflect that of CryptoGlobe.com and do not constitute financial advice. Always do your own research.


