
 Litecoin Chart by Trading View
LTCUSD Medium-term Trend: Bearish
Resistance Levels: $63, $65, $67
Support Levels: $47, $45, $43
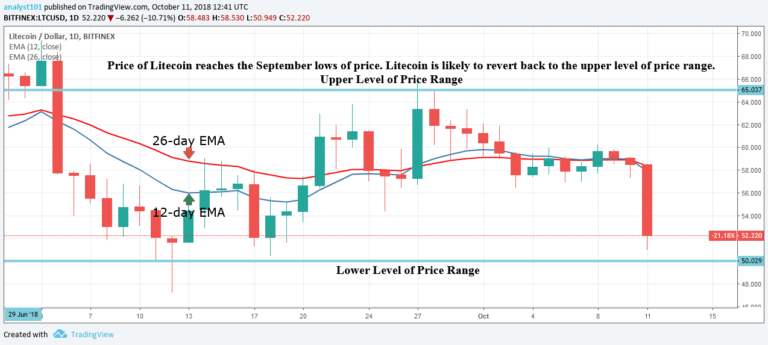
The LTCUSD pair had been fluctuating above the $57 price level but had been broken by the bearish trend. Since October 3, the price of Litecoin had been resisted at the $57 price level. However, the bearish trend had completed the range bound movement between the upper and lower level of price range.
Price is likely to revert back to the upper level of price range. In this case, traders should initiate long trades at the lower level of price range. This will enable them to earn partial profits as price moves upward. Secondly, price may likely break the lower level of price range and the cryptocurrency may depreciate further to the low of $47.
LTCUSD Short-term Trend: Bearish
 Litecoin Chart by Trading View
On the short term trend, the price of Litecoin is bearish. Litecoin had fallen to the low of $52 and commenced a range bound movement. The Relative Strength Index period 14 is level 23 which indicates that the market is oversold. The bears have exhausted their bearish pressure and the bulls are required to take control of the market.
The views and opinions expressed here do not reflect that of CryptoGlobe.com and do not constitute financial advice. Always do your own research.


