
ETHUSD Long-term Trend – Ranging
Distribution territories: $350, $450, $550.
Accumulation territories: $150, $100, $50.
Neither the bulls nor the bears were able to have a major impact on the ETHUSD trading pair over the last two weeks. In other words, the cryptocurrency’s price is currently varying under the influence of short Japanese bearish and bullish candles.

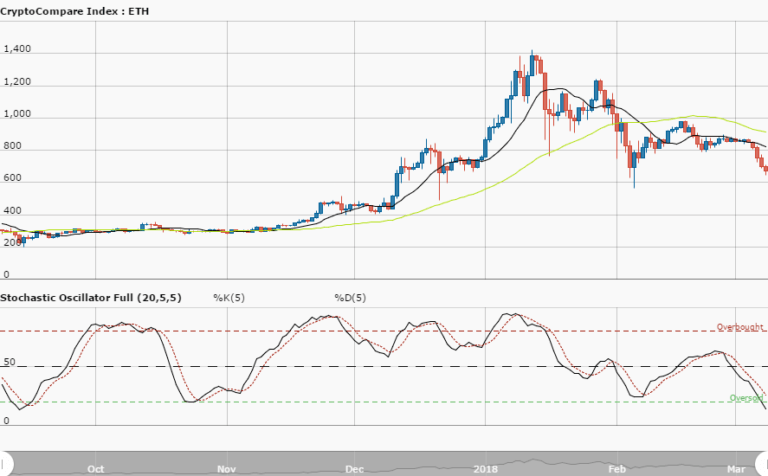
Similarly, ETH has been accompanying the 14-day SMAs trendline, beneath the 50-day SMA within the range of the $300 and $200 territories. The 50-day SMA is over the 14-day SMA although there’s a very small space between them.
The Stochastic Oscillators moved south briefly past range 60. They still point south which suggests the cryptocurrency may experience lower lows and lower highs. In the next few trading sessions, ETH may still see its price fall beyond the $200 territory. Traders may be on the lookout for a possible bearish reversal against the territory to consider entering of a long position.
The views and opinions expressed here do not reflect that of CryptoGlobe.com and do not constitute financial advice. Always do your own research.


