

BTCUSD Medium-term Trend: Ranging
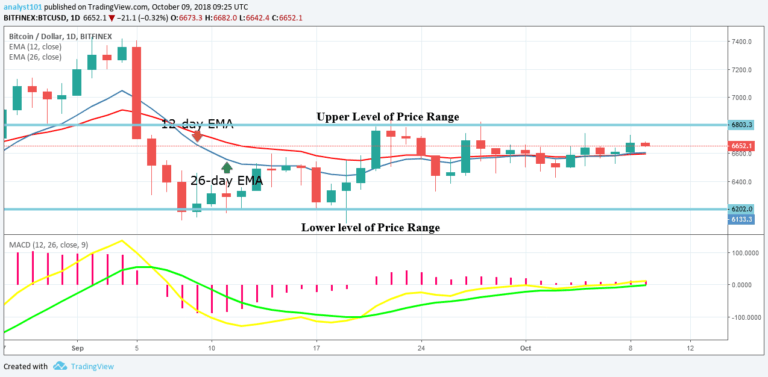
Resistance levels: $6,800, $7,000, $7,200
Support levels: $6,500, $6,300, $6,100
Yesterday, the BTCUSD pair was in a bullish trend. The cryptocurrency made another attempt to break the $6,800 price level so as to reach the $7,400 and $8,500 price levels. On September 21, the BTC price made the first attempt but was resisted.
The BTC price can come out of this range if more buyers are introduced in this range-bound zone. It has been observed that the cryptocurrency is operating on low volumes. From the chart, BTC price had been struggling on low volumes to break the resistance at $6,800 price level. This accounts for why the sellers have upper hand over the bulls. The price of Bitcoin is likely to continue its range bound movement.
Nevertheless, the MACD line and the signal line are at par with the zero line which indicates a neutral signal. The price of Bitcoin is above the 12-day EMA and the 26-day EMA which indicates that the price is rising.
BTCUSD Short-term Trend: Ranging

On the 4-hour chart, the BTC price is in a sideways trend. The price of Bitcoin is above the 12 days EMA and the 26 days EMA which indicates that the price is rising. The Relative Strength Index period 14 is level 56 which indicates that the price is in a sideways trend zone.
The views and opinions expressed here do not reflect that of CryptoGlobe.com and do not constitute financial advice. Always do your own research.


