

BTCUSD Medium-term Trend: Ranging
Resistance levels: $6,800, $7,000, $7,200
Support levels: $6,400, $6,300, $6,100
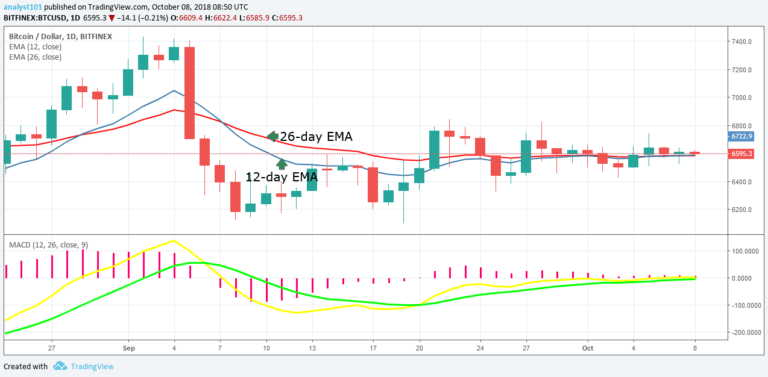
Last week the price of Bitcoin had been on a range bound movement. On September 29, the BTC price had been consolidating above the $6,500 price level. On October 3, the BTC price fell to the low of $6,456.49 and pulled back above the $6,500 price level. Since then the price of Bitcoin had been making concerted efforts to gain momentum above the $6,600 price level.
The BTC price is likely to break the $6,600 price level and reach the highs of $6,700, and $7,400. Nevertheless, the MACD line and the signal line are at par with the zero line which indicates a neutral signal. The price of Bitcoin is neither above nor below the 12-day EMA and the 26-day EMA which indicates that a sideways trend is ongoing.
BTCUSD Short-term Trend: Ranging

On the 4-hour chart, the BTC price is in a sideways trend. The cryptocurrency is still trending horizontally; this means that a breakout is imminent for Bitcoin. The Relative Strength Index period 14 is level 52 which indicates that the price is in a sideways trend zone.
The views and opinions expressed here do not reflect that of CryptoGlobe.com and do not constitute financial advice. Always do your own research.


