

BTCUSD Medium-term Trend: Ranging
Resistance levels: $6,800, $7,000, $7,200
Support levels: $6,400, $6,200, $6,000
Yesterday, the BTCUSD pair was in a bullish trend but the trend was short-lived. It was assumed that as the price rose from the levels of $6,475.56 to the high of $6,639.08; the BTC price was set to test the $6,800 price level. Today, the BTC price is range bound and has established itself below the $6,600 price level.
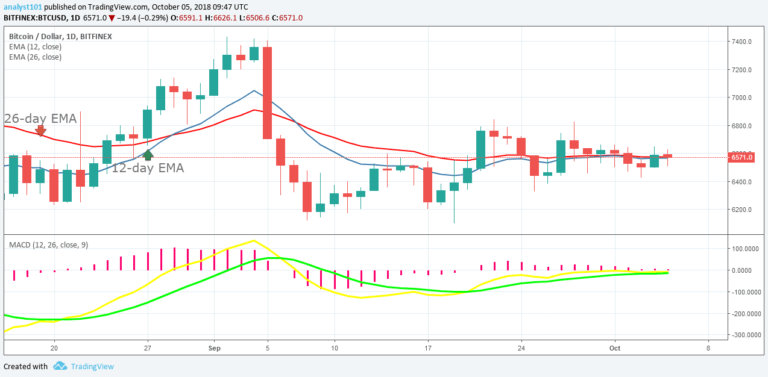
The exponential moving averages are horizontally flat indicating that the price of Bitcoin is in a sideways trend. As price of BTC is close to the support zone, a breakout will likely affect the $5900-$6,000 price levels. On the other hand, more buyers are needed at the current market price to push the price across the $6,800 and $7,400 price levels.
Meanwhile, the MACD line and the signal line are at par with the zero line which indicates a neutral signal. The price of Bitcoin is neither above nor below the 12-day EMA and the 26-day EMA which indicates that a sideways trend is ongoing.
BTCUSD Short-term Trend: Ranging

On the 4-hour chart, the BTC price is in a sideways trend. The Relative Strength Index period 14 is level 50 which indicates that the price is in a sideways trend zone.
The views and opinions expressed here do not reflect that of CryptoGlobe.com and do not constitute financial advice. Always do your own research.


