

BTCUSD Medium-term Trend: Bullish
Resistance levels: $6,800, $7,000, $7,200
Support levels: $6,500, $6,300, $6,100
Yesterday, the BTCUSD pair was in a bearish trend. The BTC price was fluctuating above the $6,500 price level; later it fell to the low of $6,475.56. It was assumed that sellers were having upper hand over the buyers. Today, the price of Bitcoin is in a bullish trend attempting to break the $6,800 price level. This will enable the BTC price to reach the high of $7,400.
However, traders can profit from the range bound movement between the $6,400 and $6,800 price levels. A bullish trend line is drawn showing the support levels of the price. After the closure of the bearish candlestick, when the price is testing the trend line, a long trade should have been initiated. Note that a long trade should be initiated each time the price tests and bounces away from the trend line.
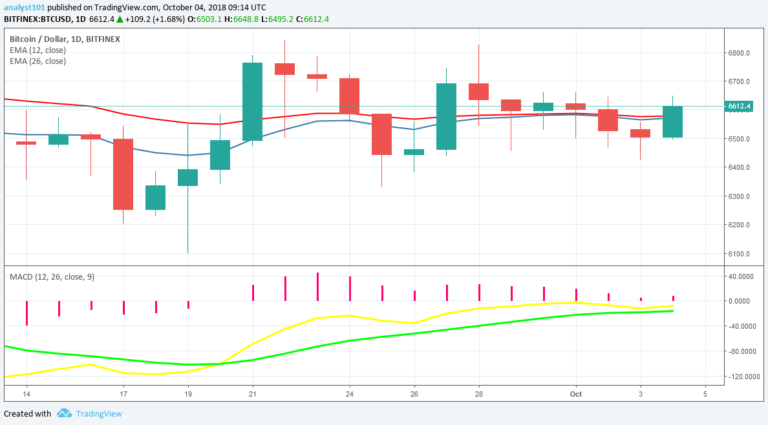
Long trades should be exited if the price is resisted at the $6,800 price level. Meanwhile, the MACD line and the signal line are at par with the zero line which indicates a neutral signal. The price of Bitcoin is above the 12-day EMA and the 26-day EMA which indicates that a bullish trend is ongoing.
BTCUSD Short-term Trend: Bullish
 Bitcoin Chart by Trading View
On the 4-hour chart, the BTC price is in a bullish trend. The BTC price is approaching the high of $6,612.40. The Relative Strength Index period 14 is level 56 which indicates that the price is in a sideways trend zone.
The views and opinions expressed here do not reflect that of CryptoGlobe.com and do not constitute financial advice. Always do your own research.


