

BTCUSD Medium-term Trend: Bearish
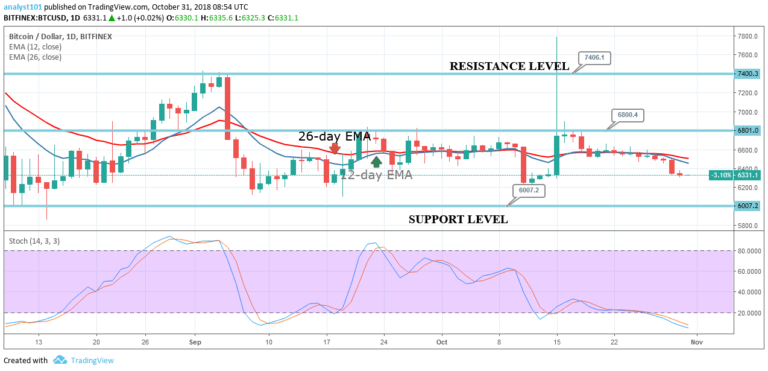
Resistance levels: $7,000, $7,100, $7,200
Support levels: $6,200, $6,100, $6,000
The BTCUSD pair was in a bearish trend yesterday. There has been no significant price movement in the last 24 hours. The price of Bitcoin fell to the $6,300 price level and commenced fluctuations above that level. The indices and the indicators are pointing in the same same direction for the price. Firstly, from the price action, the BTC price is below exponential moving averages (EMAs) and the crypto’s price is ranging for another fall.
Secondly, the Stochastic indicator has remained oversold since yesterday. The stochastic is below 20 which indicates that the momentum is strong on the downside. The price of Bitcoin is likely to fall and test the $6,200 price level which is in the lower price range. If there is more pressure at the $6,200 price level, Bitcoin will find support at the $6,000 price level.
BTCUSD Short-term Trend: Bearish

On the short term trend, Bitcoin is in a bearish trend. The crypto’s price is ranging and likely to see another price breakout. The price is below the 12-day EMA and 26-day EMA which indicates that the price is in the bearish trend zone. The Relative strength index period 14 is level 26 which indicates that the market is oversold suggesting bulls will take control of the market.
The views and opinions expressed here do not reflect that of CryptoGlobe.com and do not constitute financial advice. Always do your own research.


