
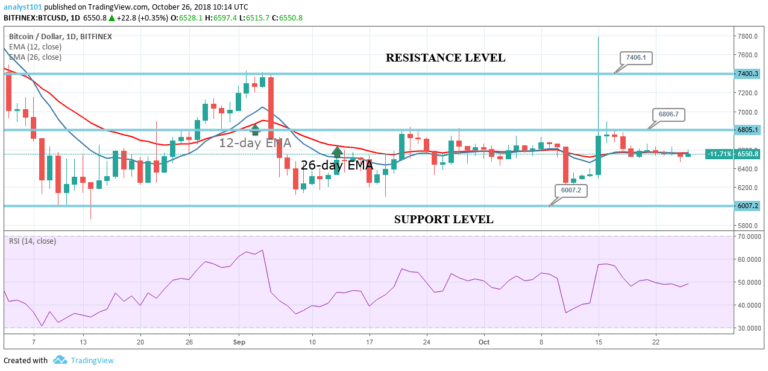

BTCUSD Medium-term Trend: Ranging
Resistance levels: $7,000, $7,200, $7,400
Support levels: $6,500, $6,300, $6,100
The price of Bitcoin is still range bound above the $6,500 price level. There had been no price movement as the anticipated levels of $6,000, $6,800 and $7,400 remained unbroken. The 12-day EMA and the 26-day EMA are horizontally flat along with the price bars indicating that the price is neither rising nor falling.The Doji and Spinning tops candlesticks indicate the indecision between the buyers and the sellers.
However, in the days to come a price breakout is imminent. Meanwhile, the price of Bitcoin is below the 12-day EMA and the 26-day EMA, indicating that the price is likely to fall. Also, the Relative Strength index period 14 is level 49 which indicates that the price is in the sideways trend zone.The cryptocurrency is likely to continue its range bound movement.
BTCUSD Short-term Trend: Ranging

On the short term trend, the price of Bitcoin is range bound above the $6,500 price level. The price bars and the exponential moving averages (EMAs) are horizontally flat indicating a sideways trend. The price of Bitcoin is neither below nor above the 12-day EMA and the 26-day EMA which indicates that the price is in the sideways trend.
The views and opinions expressed here do not reflect that of CryptoGlobe.com and do not constitute financial advice. Always do your own research.


