
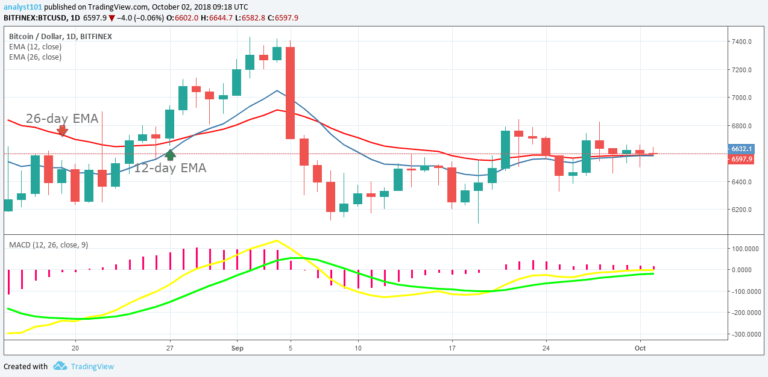

Bitcoin Price Medium-term Trend: Ranging
Resistance levels: $6,800, $7,000, $7,200
Support levels: $6,400, $6,200, $6,000
On September 29, the BTCUSD pair had been range bound. The price is consolidating for a possible breakout in the days ahead. However, the BTC price has failed to break the $6,800 price level in the last month.
If price breaks the $6,400 support level, the cryptocurrency will revisit the critical support zone of $5,900- $6,000. On the other hand, if price breaks the $6,800 price level, the BTC price will reach the high of $7,400. Volatility is expected in the coming days.
Meanwhile, the MACD line and the signal line are at par with the zero line which indicates a neutral signal. The price of Bitcoin is neither above nor below the 12-day EMA and 26-day EMA which indicates that a sideways trend is ongoing.
BTCUSD Short-term Trend: Ranging

On the 4-hour chart, the BTC price is in a range bound movement. Price is moving horizontally above the $6,500 price level. The Relative Strength Index period 14 is level 50 which indicates that price is in the range bound zone.
The views and opinions expressed here do not reflect that of CryptoGlobe.com and do not constitute financial advice. Always do your own research.


