

BTCUSD Medium-term Trend: Ranging
Resistance levels: $7,000, $7,200, $7,400
Support levels: $6,600, $6,400, $6,200
The Bitcoin price has remained in a range bound movement for a possible price breakout. On October 11, we had a bearish breakout when the BTC price was in a range bound movement.The bearish breakout took the price to the low of $6,220.40 and commenced a bullish movement. The bullish movement led us to a bullish breakout.
However, the crypto’s price had since been ranging at the $6,742 price level. Now if the price ranges and rise to the $6,800 price level, we may encounter a bullish breakout. The rpice is expected to reach the $7,400 and $8,500 price levels. On the other hand, if the range bound movement falls towards the $6,400 price level, we may encounter a bearish breakout. The price may reach the lows of $6,200 and $6,000.
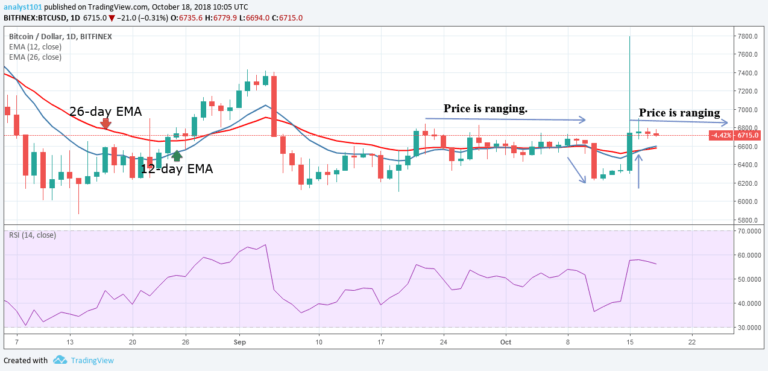
Meanwhile, the Relative Strength index period 14 is level 56 which indicates that the crypto’s price is nearing the bullish trend zone.
BTCUSD Short-term Trend: Ranging

On the short term trend, the Bitcoin price is in a range bound movement. We have three segments of range bound movement. In the first segment, we have a range bound movement that produced a bearish breakout. In the second segment, we have a range bound movement that produced a bullish breakout. In the third segment, we are expecting a price breakout as explained previously.
The views and opinions expressed here do not reflect that of CryptoGlobe.com and do not constitute financial advice. Always do your own research.


