

BTCUSD Medium-term Trend: Bullish
Resistance levels: $6,800, $7,000, $7,200
Support levels: $6,600, $6,400, $6,200
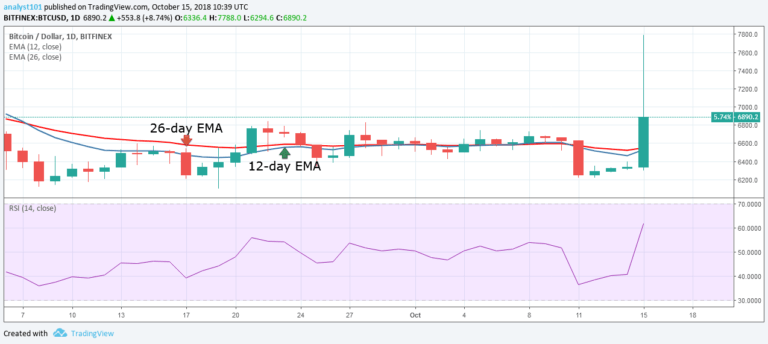
Last week the BTCUSD pair was above the $6,600 price level. The $6,600- $6,800 price levels were a resistance zone for the cryptocurrency. There was selling at this zone and price fell to the low of $6,213.45 but the price managed to recover to the upside. On October 11, the bulls and the bears were undecided about where the price will go.
Today, the range bound movement has resulted in a price rally. The cryptocurrency had a bullish trend that reached the high of $7,695.82 but the price pulled back to the low of $ 6,817.69. The price of Bitcoin is likely to retest the $7,400 price level but will face resistance at that level. Meanwhile, the Relative Strength index period 14 is level 61 which indicates that the bitcoin price is in the bullish trend zone.
BTCUSD Short-term Trend: Bullish

On the short term trend, the price of Bitcoin wass fluctuating above the $6,200 price level for the fifth day before the outcome of the bullish breakout.
The views and opinions expressed here do not reflect that of CryptoGlobe.com and do not constitute financial advice. Always do your own research.


