
BTCUSD Long-term Trend – Bearish
Distribution territories: $8,000, $9,000, $10,000.
Accumulation territories: $5,500, $5,000, $4,500
A short bullish candlestick market the BTCUSD trading pair in the first day of this week. Then, on October 15, the cryptocurrency saw its price appreciate against the US dollar as it surged to a high of $7,750.

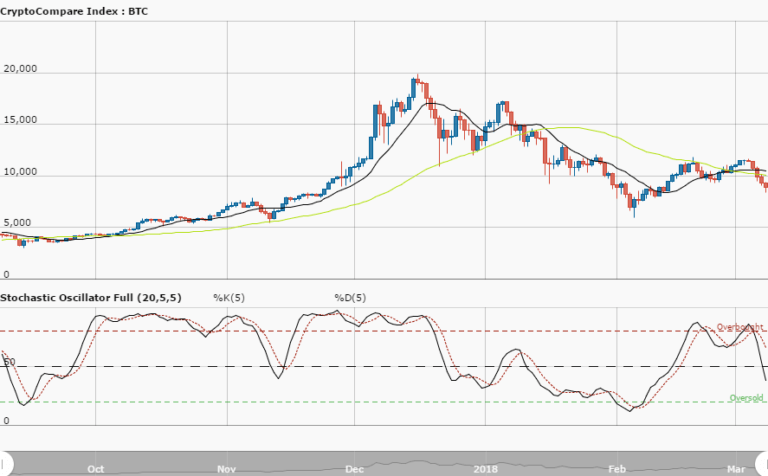
Afterwards, the market started to fall which eventually saw the cryptocurrency erase most of its gains from the day. Currently, the retracement has pushed the cryptocurrency southwards to slightly below the notable stable price mark of $6,750. Both its SMAs are moving close to each other and maintaining the same positional directions between the $6,750 and $6,500 range.
The Stochastic Oscillators have moved past range 20 and are pointing south. This suggests that the bears are somewhat present in the market. The price territories around $6,250 and $6,000 appear to be the cryptocurrency’s strongest supports. Therefore, a move below the areas may lack long-term sustainability as it can turn out to be a bear trap. Traders may look to enter a long position whenever a strong bearish reversal occurs.
The views and opinions expressed here do not reflect that of CryptoGlobe.com and do not constitute financial advice. Always do your own research.


