

XRPUSD Medium-term Trend: Bearish
Supply levels: $0.35, $0.37, $ 0.39
Demand levels: $0.26, $0.24, $0.22
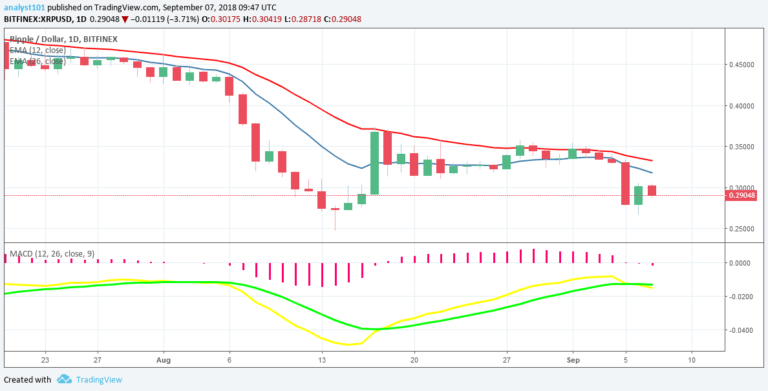
Yesterday, XRP price was in a bearish trend. A bearish breakout broke the $0.30 price level which resulted in the price falling to the low of $0.28. However, it was assumed that if price broke the $0.30 price level; the cryptocurrency would fall to the low of $0.24. Today, the XRP price is falling and approaching the low of $0.28. If the downward trend continued, the cryptocurrency will likely fall to the low of $0.24.
The MACD line and the signal line are below the zero line which indicates a sell signal. Also, the XRP price is below the 12-day EMA and the 26-day EMA which indicates that the XRP price is falling.
XRPUSD Short-term Trend: Bearish

On the 4-hour chart, the XRP price is in a bearish trend. The XRP price is falling after reaching the high of $0.30. Nevertheless, the Relative Strength Index period 14 is level 34 which indicates that the market is oversold suggesting bulls will take control of the market.
The views and opinions expressed here do not reflect that of CryptoGlobe.com and do not constitute financial advice. Always do your own research.


