

XRPUSD Medium-term Trend: Bearish
Supply levels: $0.35, $0.37, $ 0.39
Demand levels: $0.26, $0.24, $0.22
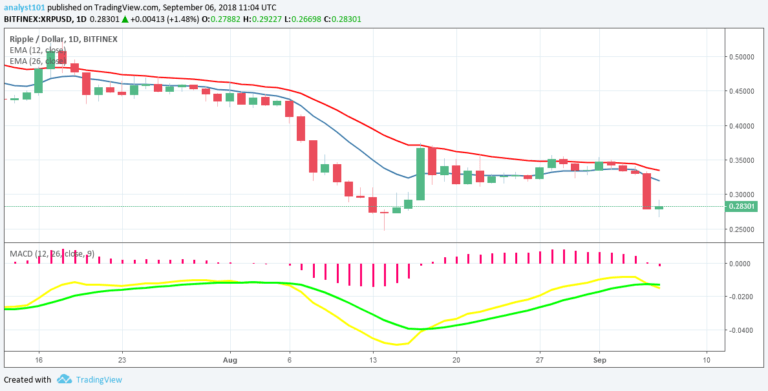
The XRPUSD pair had been in a range-bound movement between the levels of $0.36 and $0.30.Yesterday, the cryptocurrency encountered a bearish breakout which was a sudden price spike. The price broke the lower level of the price range at $0.30 – falling to the low of $0.28.
Since the lower level of price range was broken, it is likely the cryptocurrency will revisit the previous low at $0.24 which is the next support level. Traders should look out for buy setup if the price falls to the $0.24 price. In addition, the MACD line and the signal line are below the zero line which indicates a sell signal.
Also, the XRP price is below the 12-day EMA and the 26-day EMA which indicates that the XRP price is falling.
XRPUSD Short-term Trend: Bearish

On the 4-hour chart, the XRP price is in a bearish trend. The price fell to the low of $0.28 and there was price consolidation. Nevertheless, the Relative Strength Index period 14 is level 21 which indicates that the market is oversold suggesting bulls will take control of the market.
The views and opinions expressed here do not reflect that of CryptoGlobe.com and do not constitute financial advice. Always do your own research.


