

XRPUSD Medium-term Trend: Ranging
Supply levels: $0.40, $0.42, $ 0.44
Demand levels: $0.32, $0.30, $0.28
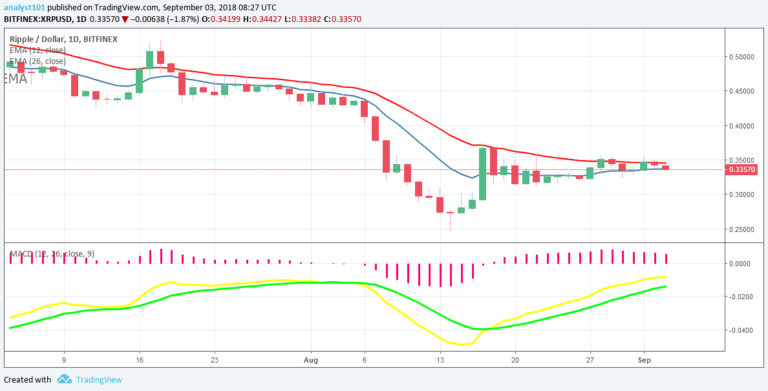
Last week the XRP price was range bound. The cryptocurrency was ranging between the levels of $0.36 and $0.30. On August 27th, the XRP price was in a bullish trend and the price reached the high of $0.35. Later the bears brought the price to its previous low at $0.30.
The XRP price made another bullish movement to the upper level of price range.
Today, the cryptocurrency is range-bound and approaching the lower level of the price range. The price is falling at the higher level because of a lack of buyers. If the downtrend continues and breaks the lower level of the price range, XRP will revisit the low at $0.24.
However, if the lower level holds, the price will continue its range-bound movement.
The MACD line and the signal line are below the zero line which indicates a sell signal.
XRPUSD Short-term Trend: Ranging

On the 4-hour chart, the XRP price is falling. The XRP price is below the 12-day EMA and the 26-day EMA which indicates that price is falling. Nevertheless, the Relative Strength Index period 14 is level 46 which indicates that price is in the sideways trend zone.
The views and opinions expressed here do not reflect that of CryptoGlobe.com and do not constitute financial advice. Always do your own research.


