

XRP Price Medium-term Trend: Bearish
Supply levels: $0.53, $0.55, $0.57
Demand levels: $0.42, $0.40, $0.38
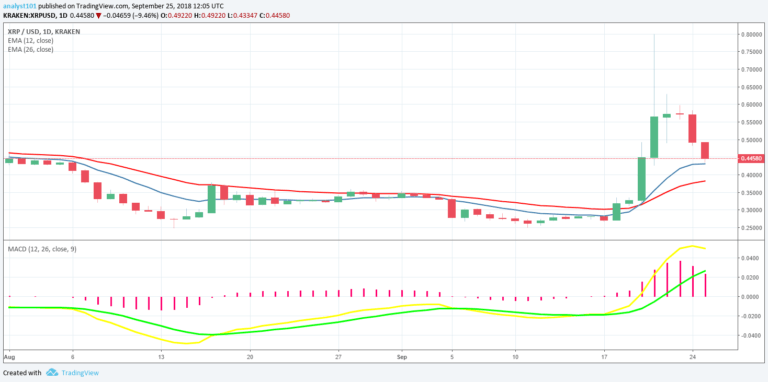
The XRPUSD pair was in a bearish trend yesterday. Last week, September 21, the cryptocurrency reached the high of $0.78 and price pulled back to the low of $0.56. Since then the price is on a downtrend trend and currently above the $0.40 price level. The question is which support level is price going to consolidate at.
One thing that will possibly happen is that price is approaching the previous range bound zone of $0.30-$0.36. If price falls into this zone, the cryptocurrency will be ranged bound. Nevertheless, the MACD line and the signal line are below the zero line which indicates a sell signal. Similarly, the price of XRP is below the 12-day EMA and 26-day EMA which indicates that a bearish trend is ongoing.
XRP Price Short-term Trend: Bearish

On the 4-hour chart, the XRP price is in a bearish trend. Meanwhile, the Relative Strength Index period 14 is level 40 which indicates that price is in the range bound trend zone.
The views and opinions expressed here do not reflect that of CryptoGlobe.com and do not constitute financial advice. Always do your own research.


